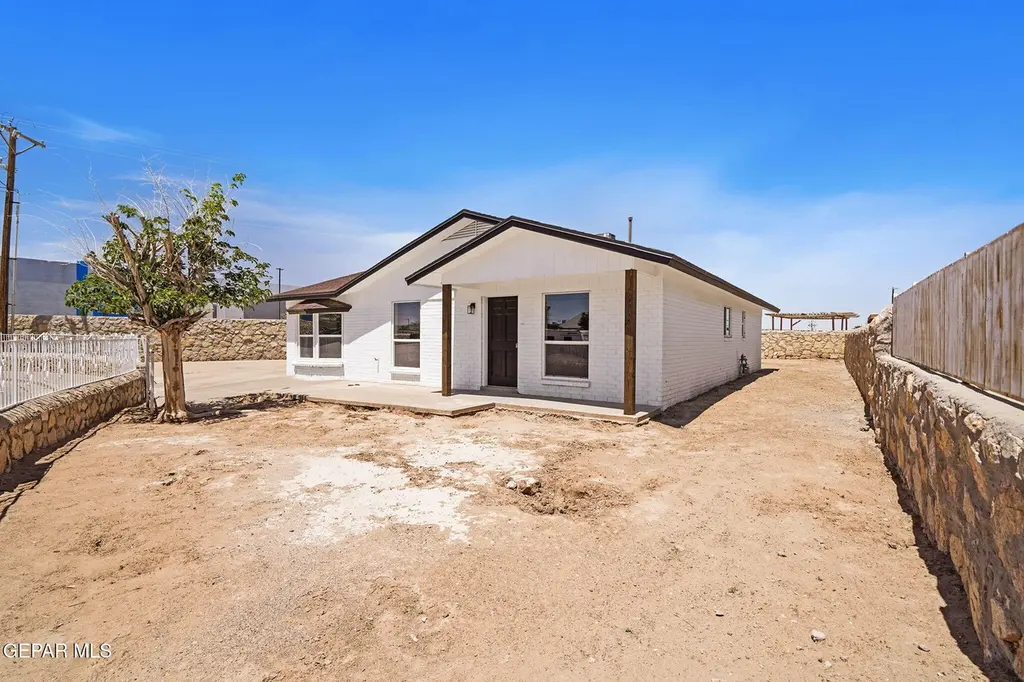
9626 Vallarta Dr
El Paso, TX 79927
$199,000D
4 bd · 1.0 ba ·
1,896 sqft ·
Built 1983
· SingleFamily
· Pending
· 7 DOM
Cashflow @ list (25.0% down · 7.5%)
Estimated rent
$1,777/mo
Mortgage (P&I)
−$1,044
Tax + insurance
−$473
HOA
−$0
Vac / Maint / Mgmt
−$373
Net cashflow
$-113/mo
Annual
$-1,359/yr
Cap rate
5.61%
Cash-on-cash
-2.44%
DSCR
0.89
1% rule
0.89%
Cash to close
$55,720
Investor read
- This is a 4-bed/1.0-bath single-family listed at $199k.
- At list price, monthly cash flow is $-113 ($-1k/yr) — negative.
- To cash-flow at today's rent, offer at most $179k (10.1% below list).
- To meet the 1% rule (rent ≥ 1% of price), the offer needs to be $178k (10.7% below list).
- Only 7 days on market — expect competitive offers; lowballing is unlikely to land.
- Recommended offer: $178k (10.7% below list) — sets the bar for 1% rule.
- Local home prices are declining (-0.9%/yr); year-one equity from $1k of loan paydown is wiped out by about $2k of value loss. Plan a longer hold.
- Location reads 81/100 on livability (#23 in TX, #1,375 nationally) — a professional / high-income tenant draw. Strengths: commute A+, cost of living A+, housing A+; Watch: employment D+.
- Ysleta ISD (urban): math 27% / reading 35% proficiency, ranked #626 of 826 in TX (top 76%) — families likely to look elsewhere, expect single-tenant / working-renter base with shorter leases; 68% free/reduced lunch — lower-income household profile, screen leases tightly.
- Zoned schools: Capistrano El (math 14% / reading 21%, grade F, #3,805 of 4,322 statewide, top 89%, 460 students, 97% FRL); Ysleta Middle (math 14% / reading 16%, grade F, #1,569 of 1,662 statewide, top 95%, 779 students, 90% FRL); Ysleta H S (math 43% / reading 37%, grade F, #809 of 1,632 statewide, top 50%, 1,342 students, 90% FRL) — zoned schools average 92% FRL vs 68% district-wide (24 pts higher); higher-poverty schools than district average — tighter screening recommended.
- Market conditions: Rents rising fast (+5.3%/yr); 218 active listings in the ZIP; 2,196 units permitted in El Paso County in 2024 (143 in 5+ unit buildings).
- El Paso County population projected at +10% by 2050 — modest demand growth; plan on rents tracking national, not racing it.
- 2 sale attempts since 20y ago with the ask held roughly flat each time — persistent listings suggest the price (not the market) is what's stuck; bring a comps-based counter.
- Climate carrying-cost: extreme-heat days projected 7→25/yr by 2055 (HVAC capex compounding) — expect insurance premiums to compound above CPI over the hold.
- This rent runs 40% of the median local income ($54k/yr) — at the standard rent-burdened threshold; future hikes will face affordability resistance.
Questions for listing agent
- What do current leases actually rent for vs. the listed asking? Can we see a recent rent roll and the last 12 months of T-12 income?
- Is there a deadline driving the sale (1031 exchange, divorce, estate, relocation)? That informs how much negotiation room exists.
- Schools are B-rated — typically a magnet for longer-tenancy family renters. What's the average tenant stay here, and is there a school-zone premium baked into asking?
- The area grade is low — what's the realistic commute time and amenity access for the typical tenant pool here? Any planned neighborhood developments (good or bad) we should know about?
- What's the average days-on-market for RENTAL listings here right now (not sales)? A rising rental-DOM trend means longer vacancies and softer asking-rent achievability than the comps imply.
- What's the recent tenant-quality profile in this submarket — average credit score on applications, eviction rate, late-payment / NSF rate, and stable-employment percentage? A property-management company in the area should have these aggregated.
- How much new for-sale + rental construction is in the pipeline within 1–3 miles? Heavy new supply typically softens prices + rents 12–24 months out; constrained supply supports both.
CashFlowRE · CFR-QPAMPJ8WP1E55D
· Data 2 weeks ago
cashflowre.app · 2026-05-29