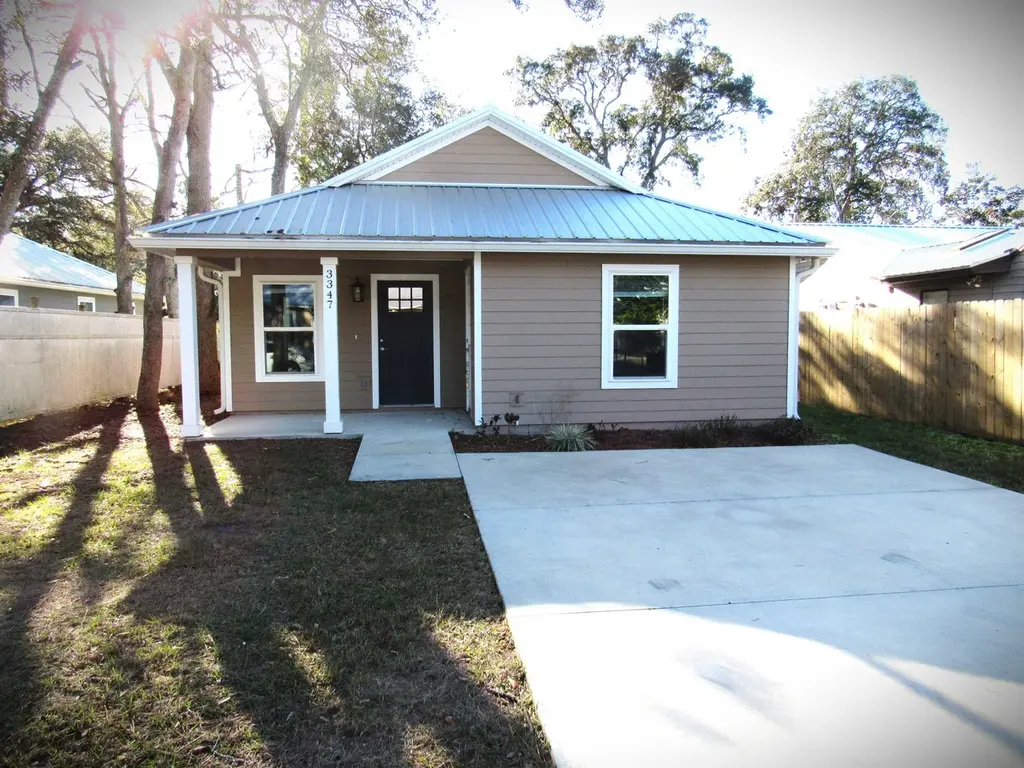
3347 7th St
St. Augustine Shores, FL 32033
$281,000D
3 bd · 2.0 ba ·
1,292 sqft ·
Built 2024
· SingleFamily
· Active
· 147 DOM
Cashflow @ list (25.0% down · 7.5%)
Estimated rent
$2,199/mo
Mortgage (P&I)
−$1,474
Tax + insurance
−$446
HOA
−$0
Vac / Maint / Mgmt
−$462
Net cashflow
$-183/mo
Annual
$-2,194/yr
Cap rate
5.51%
Cash-on-cash
-2.79%
DSCR
0.88
1% rule
0.78%
Cash to close
$78,680
Investor read
- This is a 3-bed/2.0-bath single-family listed at $281k. Condition is rated excellent.
- At list price, monthly cash flow is $-183 ($-2k/yr) — negative.
- To cash-flow at today's rent, offer at most $249k (11.5% below list).
- To meet the 1% rule (rent ≥ 1% of price), the offer needs to be $220k (21.7% below list).
- It's been on market 147 days — a 12% lower offer ($247k) is reasonable based on typical stale-listing flexibility.
- Recommended offer: $220k (21.7% below list) — sets the bar for 1% rule.
- In year one you build about $10k of equity ($2k loan paydown + $8k appreciation (2.9% local appreciation)).
- Location reads: area grade D — affects rentability + tenant quality, not the cash-flow math above.
- St. Johns (rural): math 75% / reading 73% proficiency, ranked #2 of 73 in FL (top 3%) — strong family-tenant draw, lease renewals of 3-5y typical; only 20% free/reduced lunch — higher-income household profile.
- Market conditions: 43 active listings in the ZIP; 1 comparable units currently listed for rent nearby; 5,575 units permitted in St. Johns County in 2024 (584 in 5+ unit buildings).
- St. Johns County population projected at +60% by 2050 — long-run rental-demand tailwind backs the buy-and-hold thesis.
- By year 4, paydown + projected appreciation supports a ~$34k cash-out refi (75% LTV) — recoverable capital for the next deal without selling this one.
- Cap rate 5.5% vs local median 3.4% in St. Augustine Shores — top-decile yield for the area; either an underpriced asset or a hidden risk that comps aren't pricing in. Stress-test before assuming the spread holds.
Questions for listing agent
- What do current leases actually rent for vs. the listed asking? Can we see a recent rent roll and the last 12 months of T-12 income?
- It's been on market 147 days. Have you received any prior offers? Is the seller open to a 22% concession, seller financing, or rate buy-down credit?
- Why hasn't it sold? Are there any deal-killer items the seller is aware of (foundation, flood, title, zoning, code violations)?
- Is there a deadline driving the sale (1031 exchange, divorce, estate, relocation)? That informs how much negotiation room exists.
- The area grade is low — what's the realistic commute time and amenity access for the typical tenant pool here? Any planned neighborhood developments (good or bad) we should know about?
- What's the average days-on-market for RENTAL listings here right now (not sales)? A rising rental-DOM trend means longer vacancies and softer asking-rent achievability than the comps imply.
- What's the recent tenant-quality profile in this submarket — average credit score on applications, eviction rate, late-payment / NSF rate, and stable-employment percentage? A property-management company in the area should have these aggregated.
- How much new for-sale + rental construction is in the pipeline within 1–3 miles? Heavy new supply typically softens prices + rents 12–24 months out; constrained supply supports both.
CashFlowRE · CFR-QPVC9HEBXK7V1V
· Data 5 days ago
cashflowre.app · 2026-05-29