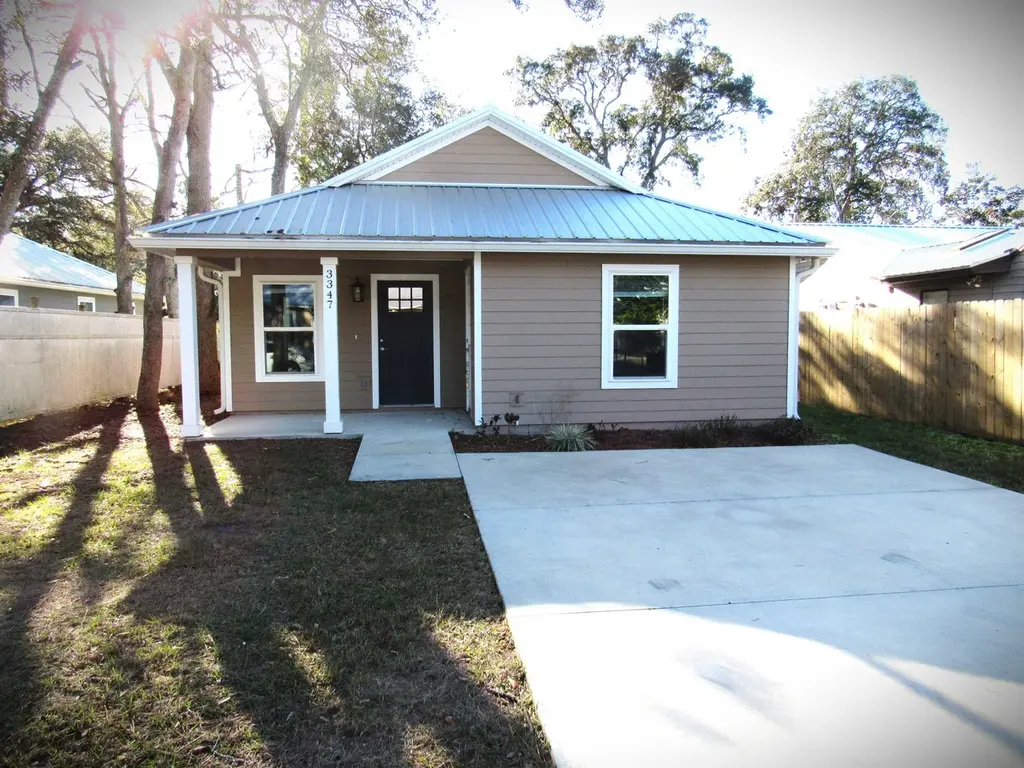
3347 7th St · St. Augustine Shores, FL
Flood risk No data
- FEMA flood zone
- —
- Chance of flooding over 30 yrs
- —
- Est. flood insurance / yr
- —
Fire risk No data
- Est. fire insurance / yr
- —
Heat risk No data
- Hot days now (above threshold)
- —
- Hot days in 30 yrs
- —
Wind risk No data
- Chance of severe wind over 30 yrs
- —
Air-quality risk No data
- Unhealthy air days now
- —
- Unhealthy air days in 30 yrs
- —
Risk factors via First Street. Map © Google.
Why this score? — see what drove the D grade
The composite is a weighted blend of 9 inputs, each scored 0–100. Each bar is that input's sub-score; the figure is the points it added to the 100-point composite (weight × sub-score).
- Cash flow +9.7/30.0
- Appreciation +6.4/10.0
- Schools +6.4/10.0
- ARV discount +5.2/15.0
- Condition / age +4.8/5.0
- 1% rule +2.8/10.0
- DSCR +2.8/10.0
- Rent growth +2.5/5.0
- Livability +2.5/5.0
$281,000
🖨 Deal sheet 📄 Offer letter ✓ Due diligence
Listing remarks MLS
Beautiful Like New 2024 built 3/2 home offers, split floor plan with open concept, vinyl wood plank flooring throughout, granite counter tops , center island , soft close cabinetry, coffee bar nook, GE stainless appliances, ceiling fans, metal roof covering with gutters, front and rear porch. partially fenced yard. Owners suite with bath & Lg walk in closet. Convenient location , minutes to St Augustine , the beaches , I95 , shopping areas. A true must see like new property!
Key facts
- Open concept
- Soft close cabinetry
- Split floor plan
Tags
Neighborhood map
What this means for you Summary
Snapshot
- This is a 3-bed/2.0-bath single-family listed at $281k. Condition is rated excellent.
Deal economics
- At list price, monthly cash flow is $-183 ($-2k/yr) — negative.
- To cash-flow at today's rent, offer at most $249k (11.5% below list).
- To meet the 1% rule (rent ≥ 1% of price), the offer needs to be $220k (21.7% below list).
- Recommended offer: $220k (21.7% below list) — sets the bar for 1% rule.
- Cap rate 5.5% vs local median 3.4% in St. Augustine Shores — top-decile yield for the area; either an underpriced asset or a hidden risk that comps aren't pricing in. Stress-test before assuming the spread holds.
Location & tenants
- Location reads: area grade D — affects rentability + tenant quality, not the cash-flow math above.
- St. Johns (rural): math 75% / reading 73% proficiency, ranked #2 of 73 in FL (top 3%) — strong family-tenant draw, lease renewals of 3-5y typical; only 20% free/reduced lunch — higher-income household profile.
- Market conditions: 43 active listings in the ZIP; 1 comparable units currently listed for rent nearby; 5,575 units permitted in St. Johns County in 2024 (584 in 5+ unit buildings).
Forward outlook
- In year one you build about $10k of equity ($2k loan paydown + $8k appreciation (2.9% local appreciation)).
- St. Johns County population projected at +60% by 2050 — long-run rental-demand tailwind backs the buy-and-hold thesis.
- By year 4, paydown + projected appreciation supports a ~$34k cash-out refi (75% LTV) — recoverable capital for the next deal without selling this one.
Negotiation context
- It's been on market 147 days — a 12% lower offer ($247k) is reasonable based on typical stale-listing flexibility.
Questions for the listing agent
- What do current leases actually rent for vs. the listed asking? Can we see a recent rent roll and the last 12 months of T-12 income?
- It's been on market 147 days. Have you received any prior offers? Is the seller open to a 22% concession, seller financing, or rate buy-down credit?
- Why hasn't it sold? Are there any deal-killer items the seller is aware of (foundation, flood, title, zoning, code violations)?
- Is there a deadline driving the sale (1031 exchange, divorce, estate, relocation)? That informs how much negotiation room exists.
- The area grade is low — what's the realistic commute time and amenity access for the typical tenant pool here? Any planned neighborhood developments (good or bad) we should know about?
- What's the average days-on-market for RENTAL listings here right now (not sales)? A rising rental-DOM trend means longer vacancies and softer asking-rent achievability than the comps imply.
- What's the recent tenant-quality profile in this submarket — average credit score on applications, eviction rate, late-payment / NSF rate, and stable-employment percentage? A property-management company in the area should have these aggregated.
- How much new for-sale + rental construction is in the pipeline within 1–3 miles? Heavy new supply typically softens prices + rents 12–24 months out; constrained supply supports both.
Investment metrics
- 1% rule
- 0.78% ✗
- Cap rate
- 5.51%
- Cash-on-cash
- -2.79%
- DSCR
- 0.88
- GRM
- 10.6
CMA / ARV
- ARV (median comp)
- $267,230
- List price
- $281,000
- Delta
- 5.15%
- Verdict
- FAIR
- Comps
- 20 within 1.0 mi
Show comp detail 12 sales within ~0.75 mi
| Address | Dist | Beds/Ba | Sqft | Sold | Price | $/sf | Match |
|---|---|---|---|---|---|---|---|
| 3357 Seventh St | 0.02mi | 3/2.0 | 1,247 (-4%) | 19mo | $285,000 | $229 | 77 |
| 3373 4th St | 0.15mi | 3/2.0 | 1,112 (-14%) | 6mo | $239,900 | $216 | 65 |
| 3367 7th St | 0.03mi | 3/2.0 | 1,171 (-9%) | 23mo | $289,900 | $248 | 64 |
| 3372 9th St | 0.09mi | 3/2.0 | 1,116 (-14%) | 12mo | $211,000 | $189 | 63 |
| 3367 7th St | 0.05mi | 3/2.0 | 1,171 (-9%) | 23mo | $289,900 | $248 | 63 |
| 3332 3rd St | 0.22mi | 3/2.0 | 1,192 (-8%) | 17mo | $250,000 | $210 | 63 |
| 3373 7th St | 0.06mi | 3/2.0 | 1,171 (-9%) | 23mo | $289,900 | $248 | 63 |
| 3377 7th St | 0.08mi | 3/2.0 | 1,171 (-9%) | 23mo | $280,000 | $239 | 62 |
| 4124 Vermont Blvd | 0.11mi | 3/2.0 | 1,118 (-14%) | 14mo | $259,000 | $232 | 61 |
| 3416 6th St | 0.17mi | 3/2.0 | 1,116 (-14%) | 11mo | $265,000 | $237 | 60 |
| 4125 Vermont Blvd | 0.16mi | 3/2.0 | 1,116 (-14%) | 12mo | $255,000 | $228 | 59 |
| 337 W New England Dr | 0.46mi | 3/2.0 | 1,434 (+11%) | 5mo | $310,000 | $216 | 56 |
Match score weights: distance 35% · size 25% · config 20% · recency 20%. Top-matched comps best support the ARV.
Projected returns pro-forma
2.87% appreciation · 3.0% rent growth · sell at horizon
- IRR
- 4.5%
- Equity multiple
- 1.26×
- Total profit
- $20,265
- Equity at exit
- $124,266
- IRR
- 7.7%
- Equity multiple
- 2.16×
- Total profit
- $90,981
- Equity at exit
- $189,905
Cash invested: $78,680 (down + closing). Projections, not guarantees.
Landlord ↔ Tenant lean methodology
- Overall (STATE)
- 87 Strongly Landlord-Friendly
- State Florida
- 87 Strongly Landlord-Friendly · R+3
- County
- — inherits STATE
- City
- — inherits STATE
ZIP-level market 32033
- Home prices YoY
- 1.0%
- Active inventory
- 43
- Price-to-rent
- 10.6×
Monthly cashflow live
- Estimated rent
- $2,199 medium interval (Pro) →
- Mortgage (P&I)
- −$1,474
- Tax from tax record
- −$329 /mo · $3,953/yr
- Insurance
- −$117
- HOA
- −$0
- Vacancy / Maint / Mgmt
- −$462
- Net cashflow
- $-183
Break-even live
UW: 25.0% down · 7.5% · 30yr · 1.5% tax · 5.0% vac · 8.0% maint · 8.0% mgmt
Financing live
Cash to close
- Down payment
- $70,250
- Closing costs
- $8,430
- Reserves months
- —
- Total cash needed
- —
Loan-product check · same deal, 3 products live
Conventional
25% down · 7.5% · 30yr
- Down + closing
- —
- Monthly P&I
- —
- Monthly cashflow
- —
- DSCR
- —
- Eligible?
- —
Personal DTI + credit; lowest rate.
DSCR
20% down · 8.5% · 30yr
- Down + closing
- —
- Monthly P&I
- —
- Monthly cashflow
- —
- DSCR
- —
- Eligible?
- —
No personal income docs; deal must DSCR.
Hard money
10% down · 12.0% · 12mo
- Down + closing
- —
- Monthly P&I
- —
- Monthly cashflow
- —
- DSCR
- —
- Eligible?
- —
Short-term bridge; refi at stabilization.
Rent comps 1 comps
| Address | Beds | Baths | Sqft | Rent | $/sqft | DOM | Units | Dist |
|---|---|---|---|---|---|---|---|---|
| 5033 Coquina Crossing Dr Elkton, FL | 3.0 | 2.0 | 1600 | $2,199 | $1.37 | 2d | 1 | 0.36mi |
Listing history 12 events
-
2026-06-15days on market $281,000 Active 147 DOM
-
2026-06-13days on market $281,000 Active 145 DOM
-
2026-06-13days on market $281,000 Active 144 DOM
-
2026-06-10days on market $281,000 Active 141 DOM
-
2026-06-08days on market $281,000 Active 140 DOM
-
2026-06-07days on market $281,000 Active 139 DOM
-
2026-06-03days on market $281,000 Active 135 DOM
-
2026-06-02days on market $281,000 Active 134 DOM
-
2026-06-01days on market $281,000 Active 133 DOM
-
2026-05-31days on market $281,000 Active 132 DOM
-
2026-01-19$291,000 Active 486-char remark
Show marketing remark (486 chars)
Beautiful Like New 2024 built 3/2 home offers, split floor plan with open concept, vinyl wood plank flooring throughout, granite counter tops , center island , soft close cabinetry, coffee bar nook, GE stainless appliances, ceiling fans, metal roof covering with gutters, front and rear porch. partially fenced yard. Owners suite with bath & Lg walk in closet. Convenient location , minutes to St Augustine , the beaches , I95 , shopping areas. A true must see like new property!
-
2024-12-13soldstatus $730,000
ⓘ Source: listings_history table (triggers on properties + properties_extension) + one-shot
backfill from property_details.listing_events for pre-trigger history.
Tax reassessment forecast FL · Resets to sale price
- Current annual tax
- $3,953 · $329/mo
- Projected year-2 tax
- $3,953 · $329/mo
- Expected delta
- $0/yr ($0/mo · 0.0%)
ⓘ Screening estimate from a state-policy table — verify with the county assessor before closing.
Nearby sold comps map
Loading sold comps map…
Walkable amenities ~0.75 mi
Loading nearby amenities…
Taxation est. · year 1
- Rental income
- $26,388
- − Mortgage interest
- −$15,740
- − Property taxes
- −$3,953
- − Insurance
- −$1,405
- − Repairs & maintenance
- −$2,111
- − Management
- −$2,111
- − Depreciation
- −$8,175
- Taxable loss
- −$7,107
- Est. tax savings @ 24.0%
- +$1,706
- After-tax cash flow
- $-489/yr
For passive investors: Depreciation is non-cash, so a rental often shows a tax loss while cash-flowing — sheltering income. Rental losses are passive: they offset passive income freely, and up to $25,000/yr can offset ordinary (W-2) income if you actively participate and your MAGI is under $100k (phasing out to $0 by $150k); unused losses carry forward. On sale, claimed depreciation is recaptured at up to 25%, and gains may owe capital-gains tax (a 1031 exchange can defer both). Figures are a year-1 estimate at your 24.0% rate — not tax advice; consult a CPA.
Condition & rehab AI · 12 photos
This 2024-built 3/2 home is in excellent condition with a fresh paint job, new kitchen, and stainless steel appliances. It's move-in ready and offers a great location with easy access to St. Augustine, the beaches, and I95.
Value-add opportunities
- Resale Paint interior walls — Fresh paint can enhance the home's curb appeal and make it more inviting.
- Both Install smart home devices — Smart home devices can increase convenience and add value for both buyers and renters.
- Both Add outdoor lighting — Outdoor lighting can improve safety and curb appeal, making the home more attractive to potential buyers and renters.
- Rental Install a smart thermostat — A smart thermostat can help reduce energy costs and attract renters who are conscious about energy efficiency.
Renovation cost estimate screening
Value-add ROI direction
- Resale Paint interior walls — Fresh paint can enhance the home's curb appeal and make it more inviting. ↑
- Both Install smart home devices — Smart home devices can increase convenience and add value for both buyers and renters. ↑
- Both Add outdoor lighting — Outdoor lighting can improve safety and curb appeal, making the home more attractive to potential buyers and renters. ↑
- Rental Install a smart thermostat — A smart thermostat can help reduce energy costs and attract renters who are conscious about energy efficiency. ↑
ⓘ Cost ranges are severity-bucket heuristics (US national rule-of-thumb). Get contractor quotes + a written scope before underwriting a rehab budget.
Schools (NCES district)
- District
- St. Johns
- NCES district ID
- 1201740
- Math proficiency
- 75% ▼ -5.00%
- Reading proficiency
- 73% ▼ -2.00%
- Median HH income
- $66,842
- Composite
- 64.31/100
- National rank
- #556
- State rank
- #2 of 73 in FL
Livability — St. Augustine Shores
No livability data for this city. (Only ~50 U.S. cities are tracked.)
Census & demographics
- Population (ZIP)
- 4,555
Population outlook (St. Johns County) Hauer SSP2
- Today (2025)
- 303,941 people
- By 2030
- 342,590 · +12.7%
- By 2040
- 417,328 · +37.3%
- By 2050
- 487,011 · +60.2%
- By 2075
- 635,395 · +109.1%
- By 2100
- 717,469 · +136.1%
Race, ethnicity, and origin ACS 2023
- Neighborhood character
- Predominantly White (80%)
- Race & ethnicity
- White 80% Hispanic / Latino 10% Two or more races 9% Black 4% Asian 2%
- Hispanic origin (detail)
- Mexican 4%
- Common ancestry
- Lithuanian 4% Romanian 3% Italian 2%
- Foreign-born
- 6% · Canada, Jamaica
- Languages at home
- 95% English-only · Spanish 4% German/W. Germanic 1%
Political lean MEDSL · St. Johns
- 2024 margin
- Solid R (+31.4) · D 33.9% · R 65.2%
- 2008→2024 swing
- +0.2pp no change · 2008: -31.6pp · 2024: -31.4pp
- All cycles
- 2024: R+31.4 2020: R+26.7 2016: R+33.4 2012: R+37.8 2008: R+31.6
Not yet ingested
- Civics
- —
Market trends
- HPI YoY
- ▲ 2.87%
- Current HPI
- 297.5438
- Rent YoY
- —
- Metro
- —
- State GDP YoY
- ▲ 3.28%
- F500 in state
- 36
Industry mix (Fortune 500 HQ in FL)
| Industry | F500 HQs | Revenue |
|---|---|---|
| Industrial Technology | 2 | $29B |
|
||
| Insurance | 2 | $17B |
|
||
| Retail | 1 | $60B |
|
||
| Technology Distribution | 1 | $58B |
|
||
| Homebuilding | 1 | $35B |
|
||
| Technology Manufacturing | 1 | $35B |
|
||
Price history
-60.1% since first listed2 events — show timeline
- 2026-01-19 Listed $291,000 St. Augustine and St. Johns County Board of REALTORS®
- 2024-12-13 Sold (Public Records) $730,000 Public Records
Property tax history
+514.3%/yrLatest (2025): $3,953 · +514.3% YoY. Source: county tax records.
Cash-flow waterfall
monthlySold comps — $/sqft
last 12 mo · ≤1 miLoading sold comps…