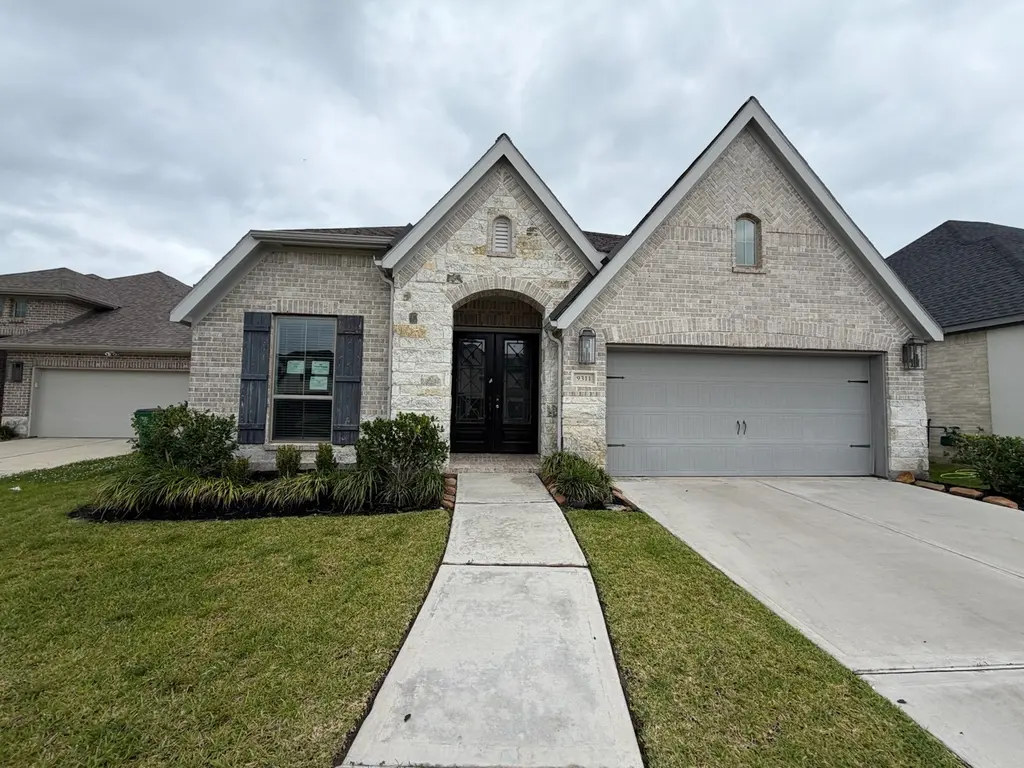
9311 Crescent Mill Dr
Sienna, TX 77459
$419,900C-
4 bd · 3.0 ba ·
2,577 sqft ·
Built 2022
· SingleFamily
· Pending
· 31 DOM
Cashflow @ list (25.0% down · 7.5%)
Estimated rent
$4,475/mo
Mortgage (P&I)
−$2,202
Tax + insurance
−$1,535
HOA
−$124
Vac / Maint / Mgmt
−$940
Net cashflow
$-326/mo
Annual
$-3,912/yr
Cap rate
5.55%
Cash-on-cash
-2.65%
DSCR
0.88
1% rule
1.07%
Cash to close
$117,572
Investor read
- This is a 4-bed/3.0-bath single-family listed at $420k. Condition is rated good.
- At list price, monthly cash flow is $-326 ($-4k/yr) — negative.
- To cash-flow at today's rent, offer at most $362k (13.7% below list).
- Meets the 1% rule at list price ($4k rent vs $420k).
- It's been on market 31 days — a 3% lower offer ($407k) is reasonable based on typical stale-listing flexibility.
- Recommended offer: $362k (13.7% below list) — sets the bar for cash-flow.
- Local home prices are declining (-1.7%/yr); year-one equity from $3k of loan paydown is wiped out by about $7k of value loss. Plan a longer hold.
- Location reads: area grade C — affects rentability + tenant quality, not the cash-flow math above.
- Fort Bend ISD (suburban): math 44% / reading 53% proficiency, ranked #140 of 826 in TX (top 17%) — families likely to look elsewhere, expect single-tenant / working-renter base with shorter leases.
- Zoned schools: Ronald Thornton Middle (math 40% / reading 52%, grade D+, #462 of 1,662 statewide, top 28%, 1,529 students, 41% FRL).
- Watch-outs: property tax is 3.7% of price; flood insurance adds $66/mo.
- Market conditions: Rents soft (-0.1%/yr); 1215 active listings in the ZIP; 4 comparable units currently listed for rent nearby; rentals at typical pace (median 22d on market — plan ~3-4 weeks tenant-placement turnaround); high-income renter base; 12,093 units permitted in Fort Bend County in 2024 (815 in 5+ unit buildings).
- Fort Bend County population projected at +75% by 2050 — long-run rental-demand tailwind backs the buy-and-hold thesis.
- 7 sale attempts since 2y ago with the ask held roughly flat each time — persistent listings suggest the price (not the market) is what's stuck; bring a comps-based counter.
- Climate carrying-cost: major flood risk; severe wind risk, 99% chance of damaging wind over 30y; extreme-heat days projected 7→23/yr by 2055 (HVAC capex compounding) — expect insurance premiums to compound above CPI over the hold.
- Cap rate 5.6% vs local median 3.3% in Sienna — top-decile yield for the area; either an underpriced asset or a hidden risk that comps aren't pricing in. Stress-test before assuming the spread holds.
- This rent runs 42% of the median local income ($129k/yr) — at the standard rent-burdened threshold; future hikes will face affordability resistance.
Questions for listing agent
- What do current leases actually rent for vs. the listed asking? Can we see a recent rent roll and the last 12 months of T-12 income?
- It's been on market 31 days. Have you received any prior offers? Is the seller open to a 14% concession, seller financing, or rate buy-down credit?
- Property tax is high relative to price — has the assessment been appealed recently, and will the sale trigger a re-assessment?
- What's the actual annual flood-insurance premium (NFIP or private), and is the property in a SFHA with mandatory coverage?
- What does the HOA fee cover, when was the last increase, and are there any pending special assessments or reserve-fund shortfalls?
- Is there a deadline driving the sale (1031 exchange, divorce, estate, relocation)? That informs how much negotiation room exists.
- What's the average days-on-market for RENTAL listings here right now (not sales)? A rising rental-DOM trend means longer vacancies and softer asking-rent achievability than the comps imply.
- What's the recent tenant-quality profile in this submarket — average credit score on applications, eviction rate, late-payment / NSF rate, and stable-employment percentage? A property-management company in the area should have these aggregated.
CashFlowRE · CFR-QQQZP23YQHNN30
· Data 6 days ago
cashflowre.app · 2026-05-29