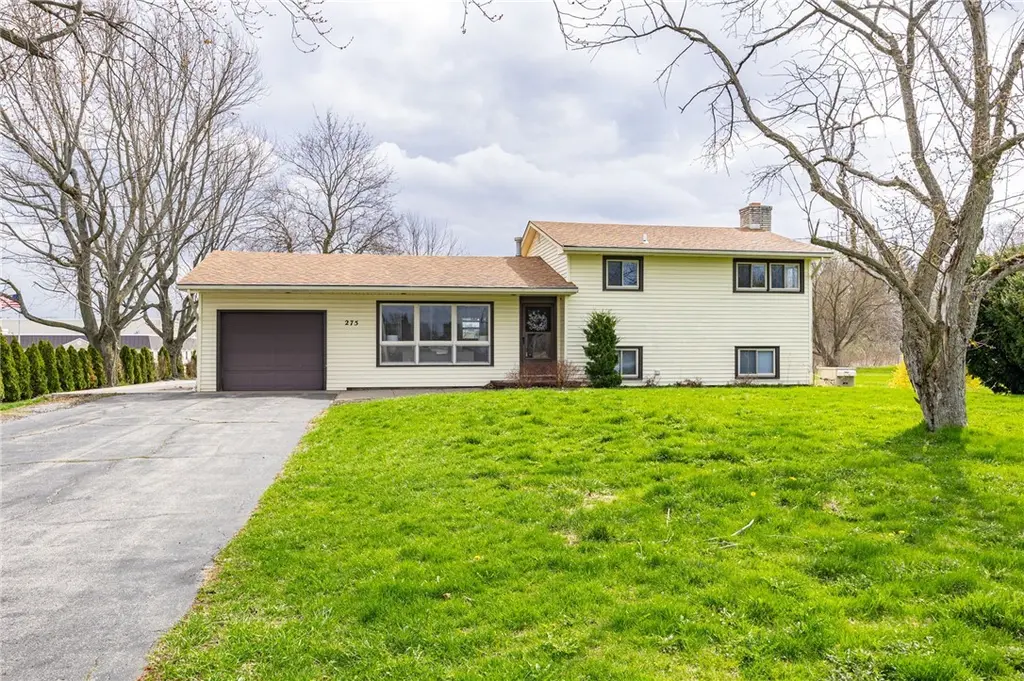
275 Ogden Center Rd
Spencerport, NY 14559
$199,900C-
3 bd · 2.0 ba ·
1,723 sqft ·
Built 1960
· SingleFamily
· Pending
· 8 DOM
Cashflow @ list (25.0% down · 7.5%)
Estimated rent
$2,057/mo
Mortgage (P&I)
−$1,048
Tax + insurance
−$615
HOA
−$0
Vac / Maint / Mgmt
−$432
Net cashflow
$-37/mo
Annual
$-449/yr
Cap rate
6.07%
Cash-on-cash
-0.80%
DSCR
0.96
1% rule
1.03%
Cash to close
$55,972
Investor read
- This is a 3-bed/2.0-bath single-family listed at $200k.
- At list price, monthly cash flow is $-37 ($-449/yr) — negative.
- To cash-flow at today's rent, offer at most $193k (3.3% below list).
- Meets the 1% rule at list price ($2k rent vs $200k).
- Only 8 days on market — expect competitive offers; lowballing is unlikely to land.
- Recommended offer: $193k (3.3% below list) — sets the bar for cash-flow.
- Local home prices are declining (-3.0%/yr); year-one equity from $1k of loan paydown is wiped out by about $6k of value loss. Plan a longer hold.
- Location reads 76/100 on livability (#237 in NY, #3,718 nationally) — a middle-class / working-renter tenant base. Strengths: housing A+, health & safety A, crime B+; Watch: amenities F, commute F.
- Spencerport Central School District (suburban): math 52% / reading 63% proficiency, ranked #248 of 590 in NY (top 42%) — acceptable for families but not a draw, mixed tenant base, ~2y average lease.
- Zoned schools: Leo Bernabi School (math 42% / reading 52%, grade D-, #1,195 of 2,108 statewide, top 60%, 375 students, 28% FRL); A M Cosgrove Middle School (math 32% / reading 53%, grade D-, #373 of 729 statewide, top 52%, 844 students, 39% FRL); Spencerport High School (math 95% / reading 96%, grade A+, #76 of 1,100 statewide, top 7%, 1,142 students, 40% FRL).
- Watch-outs: property tax is 3.2% of price.
- Market conditions: 73 active listings in the ZIP; solid renter incomes; 1,169 units permitted in Monroe County in 2024 (591 in 5+ unit buildings).
- Monroe County population projected to shrink 6% by 2050 — rents likely to lag national; underwrite the cash flow, not the appreciation.
- 2 sale attempts since 8y ago with the ask held roughly flat each time — persistent listings suggest the price (not the market) is what's stuck; bring a comps-based counter.
- Current owner paid $123k; list at $200k implies a 63% gain — meaningful room to come down on a strong offer.
- Cap rate 6.1% vs local median 3.3% in Spencerport — top-decile yield for the area; either an underpriced asset or a hidden risk that comps aren't pricing in. Stress-test before assuming the spread holds.
Questions for listing agent
- What do current leases actually rent for vs. the listed asking? Can we see a recent rent roll and the last 12 months of T-12 income?
- Built in 1960 — when were the roof, HVAC, electrical panel, plumbing, and water heater last replaced?
- Property tax is high relative to price — has the assessment been appealed recently, and will the sale trigger a re-assessment?
- Is there a deadline driving the sale (1031 exchange, divorce, estate, relocation)? That informs how much negotiation room exists.
- Schools are B-rated — typically a magnet for longer-tenancy family renters. What's the average tenant stay here, and is there a school-zone premium baked into asking?
- What's the average days-on-market for RENTAL listings here right now (not sales)? A rising rental-DOM trend means longer vacancies and softer asking-rent achievability than the comps imply.
- What's the recent tenant-quality profile in this submarket — average credit score on applications, eviction rate, late-payment / NSF rate, and stable-employment percentage? A property-management company in the area should have these aggregated.
- How much new for-sale + rental construction is in the pipeline within 1–3 miles? Heavy new supply typically softens prices + rents 12–24 months out; constrained supply supports both.
CashFlowRE · CFR-QR7ZAP7CW14RPZ
· Data 4 weeks ago
cashflowre.app · 2026-05-29