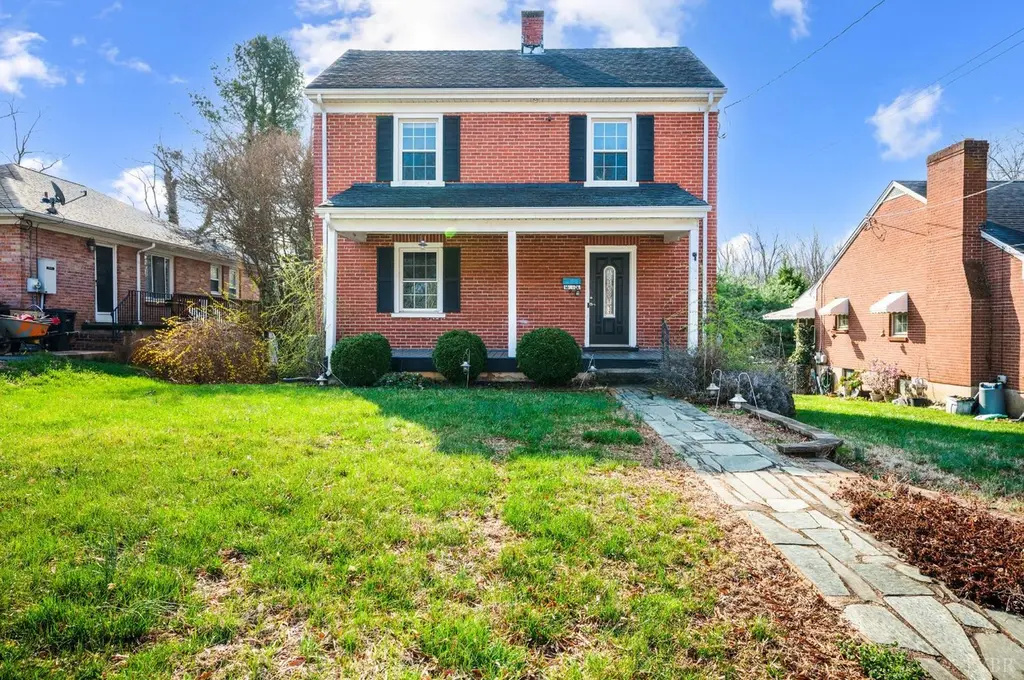
4610 Alabama Ave
Lynchburg, VA 24502
$184,900D+
2 bd · 1.5 ba ·
1,340 sqft ·
Built 1927
· SingleFamily
· Active
· 93 DOM
Cashflow @ list (25.0% down · 7.5%)
Estimated rent
$1,459/mo
Mortgage (P&I)
−$970
Tax + insurance
−$225
HOA
−$0
Vac / Maint / Mgmt
−$306
Net cashflow
$-43/mo
Annual
$-512/yr
Cap rate
6.02%
Cash-on-cash
-0.99%
DSCR
0.96
1% rule
0.79%
Cash to close
$51,772
Investor read
- This is a 2-bed/1.5-bath single-family listed at $185k.
- At list price, monthly cash flow is $-43 ($-512/yr) — negative.
- To cash-flow at today's rent, offer at most $177k (4.1% below list).
- To meet the 1% rule (rent ≥ 1% of price), the offer needs to be $146k (21.1% below list).
- It's been on market 93 days — a 9% lower offer ($168k) is reasonable based on typical stale-listing flexibility.
- Recommended offer: $146k (21.1% below list) — sets the bar for 1% rule.
- Local home prices are declining (-3.0%/yr); year-one equity from $1k of loan paydown is wiped out by about $6k of value loss. Plan a longer hold.
- Location reads 91/100 on livability (#1 in VA, #58 nationally) — a professional / high-income tenant draw. Strengths: amenities A+, commute A+, cost of living A+; Watch: crime C-, employment D+.
- Lynchburg City Public School District (urban): math 36% / reading 61% proficiency, ranked #104 of 131 in VA (top 79%) — families likely to look elsewhere, expect single-tenant / working-renter base with shorter leases; 61% free/reduced lunch — lower-income household profile, screen leases tightly.
- Watch-outs: built in 1927 — expect roof / HVAC / electrical / plumbing capex.
- Market conditions: Rents rising fast (+5.1%/yr); 318 active listings in the ZIP; 24 comparable units currently listed for rent nearby; rentals at typical pace (median 22d on market — plan ~3-4 weeks tenant-placement turnaround); 472 units permitted in Lynchburg city in 2024 (240 in 5+ unit buildings).
- Lynchburg County population projected at +37% by 2050 — long-run rental-demand tailwind backs the buy-and-hold thesis.
- 4 sale attempts since 4y ago; this cycle's ask has dropped $15k (8%) from the opening price — seller is motivated, your offer sets the floor, not the list.
- Climate carrying-cost: extreme-heat days projected 7→18/yr by 2055 (HVAC capex compounding) — expect insurance premiums to compound above CPI over the hold.
- Cap rate 6.0% vs local median 4.0% in Lynchburg — top-decile yield for the area; either an underpriced asset or a hidden risk that comps aren't pricing in. Stress-test before assuming the spread holds.
Questions for listing agent
- What do current leases actually rent for vs. the listed asking? Can we see a recent rent roll and the last 12 months of T-12 income?
- It's been on market 93 days. Have you received any prior offers? Is the seller open to a 21% concession, seller financing, or rate buy-down credit?
- Built in 1927 — when were the roof, HVAC, electrical panel, plumbing, and water heater last replaced?
- Why hasn't it sold? Are there any deal-killer items the seller is aware of (foundation, flood, title, zoning, code violations)?
- Is there a deadline driving the sale (1031 exchange, divorce, estate, relocation)? That informs how much negotiation room exists.
- Schools are A-rated — typically a magnet for longer-tenancy family renters. What's the average tenant stay here, and is there a school-zone premium baked into asking?
- The area grade is low — what's the realistic commute time and amenity access for the typical tenant pool here? Any planned neighborhood developments (good or bad) we should know about?
- What's the average days-on-market for RENTAL listings here right now (not sales)? A rising rental-DOM trend means longer vacancies and softer asking-rent achievability than the comps imply.
CashFlowRE · CFR-QS4C6BCAFJ3WTA
· Data 1 day ago
cashflowre.app · 2026-05-29