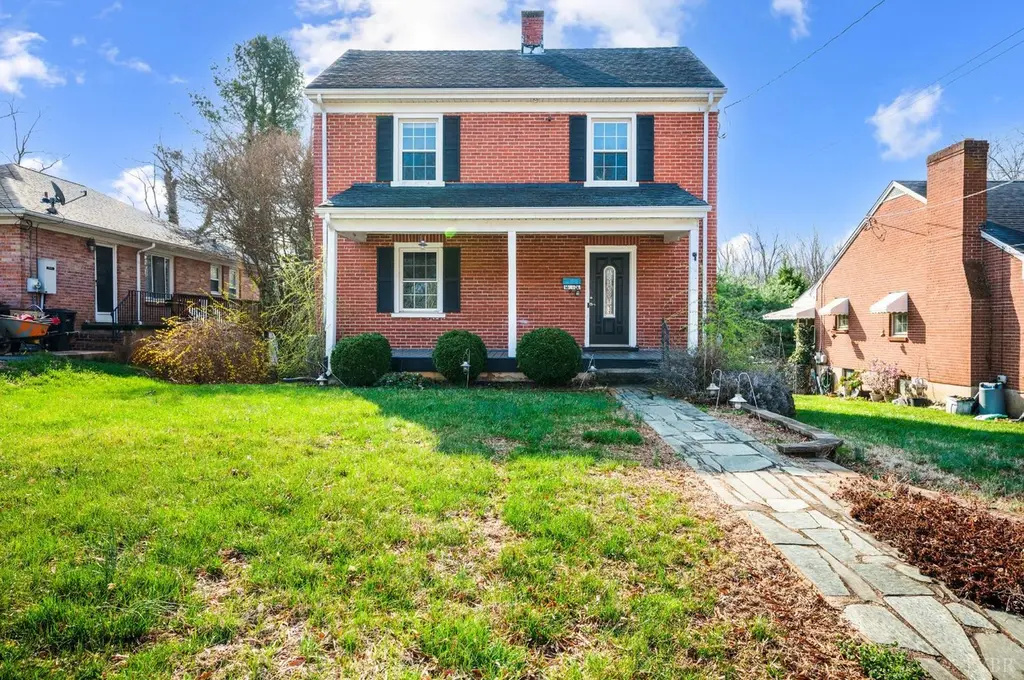
4610 Alabama Ave · Lynchburg, VA
Flood risk 1/10 · Minimal
- FEMA flood zone
- X (unshaded)
- Chance of flooding over 30 yrs
- 0.0%
- Est. flood insurance / yr
- $473 – $860
Fire risk 1/10 · Minimal
- Est. fire insurance / yr
- $666 – $1,236
Heat risk 6/10 · Moderate
- Hot days now (above 101°F)
- 7 days/yr
- Hot days in 30 yrs
- 18 days/yr
Wind risk 2/10 · Minimal
- Chance of severe wind over 30 yrs
- 2.0%
Air-quality risk 2/10 · Minimal
- Unhealthy air days now
- 0 days/yr
- Unhealthy air days in 30 yrs
- 1 days/yr
Risk factors via First Street. Map © Google.
Why this score? — see what drove the D+ grade
The composite is a weighted blend of 9 inputs, each scored 0–100. Each bar is that input's sub-score; the figure is the points it added to the 100-point composite (weight × sub-score).
- ARV discount +15.0/15.0
- Cash flow +12.0/30.0
- Livability +4.5/5.0
- Schools +4.0/10.0
- Rent growth +3.8/5.0
- DSCR +3.6/10.0
- 1% rule +2.9/10.0
- Condition / age +2.5/5.0
- Appreciation +0.0/10.0
$184,900
🖨 Deal sheet 📄 Offer letter ✓ Due diligence
Listing remarks MLS
WELCOME to this Stately 2-story Colonial on Alabama Avenue in the heart of the city. You'll love the flagstone walkway to the charming front porch, off-street parking, plus your own dedicated concrete driveway. Flower beds to fill with summer flowers, seasonal plants, and add to the charm of this brick home. Step inside to gleaming hardwoods, living room with fireplace, formal dining room too. The functional kitchen boasts updates and even includes a refrigerator in the butler's pantry. Plenty of cabinets and counter space, nice appliances, attractive backsplash, extra pantry shelving area too, Half bath on main level is nicely remodeled, and adorable. The covered porch leads to a lovely rear yard, patio below, a place you'll want to spend most of your time, and enjoy relaxing and entertaining guests. Second level boasts primary bedroom, plus two other bedrooms, and remodeled full bath. Basement offers plenty of storage. First-time home buyers will delight, or investors. WOW!
Key facts
- Charming front porch
- Flagstone walkway
- Flower beds
Tags
Neighborhood map
What this means for you Summary
Snapshot
- This is a 2-bed/1.5-bath single-family listed at $185k.
Deal economics
- At list price, monthly cash flow is $-43 ($-512/yr) — negative.
- To cash-flow at today's rent, offer at most $177k (4.1% below list).
- To meet the 1% rule (rent ≥ 1% of price), the offer needs to be $146k (21.1% below list).
- Recommended offer: $146k (21.1% below list) — sets the bar for 1% rule.
- Cap rate 6.0% vs local median 4.0% in Lynchburg — top-decile yield for the area; either an underpriced asset or a hidden risk that comps aren't pricing in. Stress-test before assuming the spread holds.
Location & tenants
- Location reads 91/100 on livability (#1 in VA, #58 nationally) — a professional / high-income tenant draw. Strengths: amenities A+, commute A+, cost of living A+; Watch: crime C-, employment D+.
- Lynchburg City Public School District (urban): math 36% / reading 61% proficiency, ranked #104 of 131 in VA (top 79%) — families likely to look elsewhere, expect single-tenant / working-renter base with shorter leases; 61% free/reduced lunch — lower-income household profile, screen leases tightly.
- Market conditions: Rents rising fast (+5.1%/yr); 318 active listings in the ZIP; 24 comparable units currently listed for rent nearby; rentals at typical pace (median 21d on market — plan ~3-4 weeks tenant-placement turnaround); 472 units permitted in Lynchburg city in 2024 (240 in 5+ unit buildings).
Forward outlook
- Local home prices are declining (-3.0%/yr); year-one equity from $1k of loan paydown is wiped out by about $6k of value loss. Plan a longer hold.
- Lynchburg County population projected at +37% by 2050 — long-run rental-demand tailwind backs the buy-and-hold thesis.
Negotiation context
- It's been on market 93 days — a 9% lower offer ($168k) is reasonable based on typical stale-listing flexibility.
- 4 sale attempts since 4y ago; this cycle's ask has dropped $15k (8%) from the opening price — seller is motivated, your offer sets the floor, not the list.
Risks & watch-outs
- Watch-outs: built in 1927 — expect roof / HVAC / electrical / plumbing capex.
- Climate carrying-cost: extreme-heat days projected 7→18/yr by 2055 (HVAC capex compounding) — expect insurance premiums to compound above CPI over the hold.
Questions for the listing agent
- What do current leases actually rent for vs. the listed asking? Can we see a recent rent roll and the last 12 months of T-12 income?
- It's been on market 93 days. Have you received any prior offers? Is the seller open to a 21% concession, seller financing, or rate buy-down credit?
- Built in 1927 — when were the roof, HVAC, electrical panel, plumbing, and water heater last replaced?
- Why hasn't it sold? Are there any deal-killer items the seller is aware of (foundation, flood, title, zoning, code violations)?
- Is there a deadline driving the sale (1031 exchange, divorce, estate, relocation)? That informs how much negotiation room exists.
- Schools are A-rated — typically a magnet for longer-tenancy family renters. What's the average tenant stay here, and is there a school-zone premium baked into asking?
- The area grade is low — what's the realistic commute time and amenity access for the typical tenant pool here? Any planned neighborhood developments (good or bad) we should know about?
- What's the average days-on-market for RENTAL listings here right now (not sales)? A rising rental-DOM trend means longer vacancies and softer asking-rent achievability than the comps imply.
- What's the recent tenant-quality profile in this submarket — average credit score on applications, eviction rate, late-payment / NSF rate, and stable-employment percentage? A property-management company in the area should have these aggregated.
- How much new for-sale + rental construction is in the pipeline within 1–3 miles? Heavy new supply typically softens prices + rents 12–24 months out; constrained supply supports both.
Investment metrics
- 1% rule
- 0.79% ✗
- Cap rate
- 6.02%
- Cash-on-cash
- -0.99%
- DSCR
- 0.96
- GRM
- 10.6
CMA / ARV
- ARV (median comp)
- $230,751
- List price
- $184,900
- Delta
- -19.87%
- Verdict
- UNDERPRICED
- Comps
- 20 within 1.0 mi
Show comp detail 12 sales within ~0.75 mi
| Address | Dist | Beds/Ba | Sqft | Sold | Price | $/sf | Match |
|---|---|---|---|---|---|---|---|
| 4604 Oakdale Dr | 0.21mi | 2/1.5 | 1,435 (+7%) | 4mo | $224,900 | $157 | 75 |
| 4624 Greenwood Dr | 0.34mi | 3/1.0 (+1) | 1,328 (-1%) | 2mo | $200,000 | $151 | 74 |
| 1029 Lindsay St | 0.48mi | 3/2.5 (+1) | 1,352 (+1%) | 2mo | $334,900 | $248 | 65 |
| 707 Crestwood Cir | 0.19mi | 3/1.0 (+1) | 1,197 (-11%) | 4mo | $215,000 | $180 | 64 |
| 813 Westview Dr | 0.47mi | 3/1.5 (+1) | 1,262 (-6%) | 3mo | $241,000 | $191 | 61 |
| 1116 Toledo Ave | 0.50mi | 3/1.5 (+1) | 1,260 (-6%) | 2mo | $205,000 | $163 | 60 |
| 1136 Moseley Dr | 0.71mi | 3/1.5 (+1) | 1,344 (+0%) | 3mo | $259,900 | $193 | 59 |
| 1128 Toledo Ave | 0.43mi | 3/1.5 (+1) | 1,468 (+10%) | 1mo | $245,000 | $167 | 58 |
| 1308 Mckinney Ave | 0.65mi | 3/1.0 (+1) | 1,274 (-5%) | 2mo | $219,900 | $173 | 53 |
| 1305 Radcliff Ave. Ave | 0.65mi | 3/1.5 (+1) | 1,223 (-9%) | 3mo | $216,000 | $177 | 48 |
| 1101 Toledo Ave | 0.56mi | 3/1.5 (+1) | 1,143 (-15%) | 4mo | $150,000 | $131 | 41 |
| 319 Oakridge Blvd | 0.73mi | 2/1.0 | 1,162 (-13%) | 2mo | $165,800 | $143 | 40 |
Match score weights: distance 35% · size 25% · config 20% · recency 20%. Top-matched comps best support the ARV.
Projected returns pro-forma
-3.0% appreciation · 5.11% rent growth · sell at horizon
- IRR
- -15.8%
- Equity multiple
- 0.43×
- Total profit
- $-29,544
- Equity at exit
- $27,569
- IRR
- -4.3%
- Equity multiple
- 0.69×
- Total profit
- $-15,793
- Equity at exit
- $15,987
Cash invested: $51,772 (down + closing). Projections, not guarantees.
Landlord ↔ Tenant lean methodology
- Overall (STATE)
- 55 Moderately Landlord-Leaning
- State Virginia
- 55 Moderately Landlord-Leaning · D+2
- County
- — inherits STATE
- City
- — inherits STATE
ZIP-level market 24502
- Rents YoY
- 5.1%
- Active inventory
- 318
- Price-to-rent
- 10.6×
Monthly cashflow live
- Estimated rent
- $1,459 high interval (Pro) →
- Mortgage (P&I)
- −$970
- Tax from tax record
- −$148 /mo · $1,779/yr
- Insurance
- −$77
- HOA
- −$0
- Vacancy / Maint / Mgmt
- −$306
- Net cashflow
- $-43
Break-even live
UW: 25.0% down · 7.5% · 30yr · 1.5% tax · 5.0% vac · 8.0% maint · 8.0% mgmt
Financing live
Cash to close
- Down payment
- $46,225
- Closing costs
- $5,547
- Reserves months
- —
- Total cash needed
- —
Loan-product check · same deal, 3 products live
Conventional
25% down · 7.5% · 30yr
- Down + closing
- —
- Monthly P&I
- —
- Monthly cashflow
- —
- DSCR
- —
- Eligible?
- —
Personal DTI + credit; lowest rate.
DSCR
20% down · 8.5% · 30yr
- Down + closing
- —
- Monthly P&I
- —
- Monthly cashflow
- —
- DSCR
- —
- Eligible?
- —
No personal income docs; deal must DSCR.
Hard money
10% down · 12.0% · 12mo
- Down + closing
- —
- Monthly P&I
- —
- Monthly cashflow
- —
- DSCR
- —
- Eligible?
- —
Short-term bridge; refi at stabilization.
Rent comps 24 comps
| Address | Beds | Baths | Sqft | Rent | $/sqft | DOM | Units | Dist |
|---|---|---|---|---|---|---|---|---|
| 4607 Fairmont Ave Lynchburg, VA | 3.0 | 1.0 | 1001 | $1,650 | $1.65 | 21d | 1 | 0.06mi |
| 4612 Greenwood Dr Lynchburg, VA | 3.0 | 1.0 | 1257 | $1,595 | $1.27 | 21d | 1 | 0.31mi |
| 1009 Lindsay St Lynchburg, VA | 3.0 | 2.0 | 1050 | $1,800 | $1.71 | 43d | 1 | 0.41mi |
| 4647 Ferncliff Dr Lynchburg, VA | 2.0 | 2.0 | 1034 | $1,800 | $1.74 | 43d | 1 | 0.46mi |
| 4300 Tremont St Lynchburg, VA | 3.0 | 1.0 | 1122 | $1,200 | $1.07 | 43d | 1 | 0.48mi |
| 4067 Fort Ave Unit 3 Lynchburg, VA | 2.0 | 1.0 | 950 | $995 | $1.05 | 21d | 1 | 0.72mi |
| 101 Thomas Rd Unit A Lynchburg, VA | 3.0 | 1.0 | 1530 | $1,395 | $0.91 | 43d | 1 | 0.84mi |
| 1320 Saint Cloud Ave Lynchburg, VA | 3.0 | 1.0 | 960 | $1,550 | $1.61 | 44d | 1 | 0.84mi |
| 5621 Killarney Pl Lynchburg, VA | 3.0 | 1.0 | 1180 | $1,575 | $1.33 | 13d | 1 | 1.02mi |
| 1400 Weeping Willow Dr Apt A Lynchburg, VA | 1.0–3.0 | 1.0–2.0 | 1003 | $1,286 | $1.28 | 13d | 12 | 1.03mi |
| 5900 Fort Ave Lynchburg, VA | 3.0 | 3.0 | 1200 | $1,595 | $1.33 | 21d | 1 | 1.07mi |
| 5900 Fort Ave Lynchburg, VA | 3.0 | 3.0 | 1221 | $1,595 | $1.31 | 43d | 1 | 1.07mi |
| 106 Yeardley Ave Unit B Lynchburg, VA | 3.0 | 1.0 | 1060 | $895 | $0.84 | 21d | 1 | 1.16mi |
| 5900 Edgewood Ave Lynchburg, VA | 3.0 | 1.0 | 1528 | $1,400 | $0.92 | 13d | 1 | 1.17mi |
| 540 Monticello Ave Unit B Lynchburg, VA | 2.0 | 1.0 | 900 | $995 | $1.11 | 21d | 1 | 1.20mi |
| 307 Killarney Ct Lynchburg, VA | 2.0 | 1.5 | 1100 | $1,035 | $0.94 | 21d | 1 | 1.22mi |
| 803 Mansfield Ave Lynchburg, VA | 2.0 | 1.0 | 900 | $1,300 | $1.44 | 21d | 1 | 1.22mi |
| 311 Killarney Ct Lynchburg, VA | 3.0 | 2.0 | 1300 | $1,295 | $1.00 | 43d | 1 | 1.23mi |
| 412 Kerry Ln Lynchburg, VA | 1.0–3.0 | 1.0–2.0 | 1030 | $1,108 | $1.08 | 13d | 12 | 1.28mi |
| 403 Kerry Ln Lynchburg, VA | 3.0 | 2.0 | 1300 | $1,295 | $1.00 | 13d | 1 | 1.30mi |
| 220 McConville Rd Lynchburg, VA | 2.0–3.0 | 2.0 | 1070 | $990 | $0.93 | 13d | 6 | 1.36mi |
| 111 McConville Rd Lynchburg, VA | 3.0 | 1.0 | 912 | $1,105 | $1.21 | 13d | 1 | 1.47mi |
| 216 Kenyon St Lynchburg, VA | 2.0 | 1.0 | 1114 | $995 | $0.89 | 43d | 1 | 1.49mi |
| 101 1/2 Hampden Dr Unit 4 Lynchburg, VA | 2.0 | 1.5 | 1040 | $950 | $0.91 | 21d | 1 | 1.50mi |
Listing history 44 events
-
2026-06-19days on market $184,900 Active 93 DOM
-
2026-06-18days on market $184,900 Active 92 DOM
-
2026-06-17days on market $184,900 Active 91 DOM
-
2026-06-16days on market $184,900 Active 90 DOM
-
2026-06-15days on market $184,900 Active 89 DOM
-
2026-06-14days on market $184,900 Active 87 DOM
-
2026-06-13days on market $184,900 Active 86 DOM
-
2026-06-10days on market $184,900 Active 84 DOM
-
2026-06-09days on market $184,900 Active 83 DOM
-
2026-06-08days on market $184,900 Active 82 DOM
-
2026-06-07pricedays on market $184,900 Active 81 DOM
-
2026-06-03days on market $199,900 Active 77 DOM
-
2026-06-02days on market $199,900 Active 76 DOM
-
2026-06-01days on market $199,900 Active 75 DOM
-
2026-05-31days on market $199,900 Active 74 DOM
-
2026-05-30days on market $199,900 Active 73 DOM
-
2026-03-18$199,900 Active 990-char remark
Show marketing remark (990 chars)
WELCOME to this Stately 2-story Colonial on Alabama Avenue in the heart of the city. You'll love the flagstone walkway to the charming front porch, off-street parking, plus your own dedicated concrete driveway. Flower beds to fill with summer flowers, seasonal plants, and add to the charm of this brick home. Step inside to gleaming hardwoods, living room with fireplace, formal dining room too. The functional kitchen boasts updates and even includes a refrigerator in the butler's pantry. Plenty of cabinets and counter space, nice appliances, attractive backsplash, extra pantry shelving area too, Half bath on main level is nicely remodeled, and adorable. The covered porch leads to a lovely rear yard, patio below, a place you'll want to spend most of your time, and enjoy relaxing and entertaining guests. Second level boasts primary bedroom, plus two other bedrooms, and remodeled full bath. Basement offers plenty of storage. First-time home buyers will delight, or investors. WOW!
-
2025-12-29status Pending
-
2025-12-19price $202,999
-
2025-11-12price $203,000
-
2025-11-06price $204,500
-
2025-10-30price $205,500
-
2025-10-22price $206,500
-
2025-10-16price $207,000
-
2025-10-11price $207,500
-
2025-10-01price $208,000
-
2025-09-16price $208,500
-
2025-09-10price $209,000
-
2025-08-31price $209,500
-
2025-07-09price $210,000
-
2025-07-03price $215,000
-
2025-06-17price $219,999
-
2025-05-02price $224,999
-
2025-04-19status Active
-
2025-04-08status Pending
-
2025-02-27$225,000 Active
-
2022-11-09historical
-
2022-11-07soldstatus $189,900 Closed
-
2022-11-07soldstatus $189,900
-
2022-09-29status Pending
-
2022-09-14$189,900 Active
-
2011-10-03soldstatus $107,900
-
2009-12-30soldstatus $84,500
-
2004-07-23soldstatus $80,100
ⓘ Source: listings_history table (triggers on properties + properties_extension) + one-shot
backfill from property_details.listing_events for pre-trigger history.
Tax reassessment forecast VA · Resets to sale price
- Current annual tax
- $1,779 · $148/mo
- Projected year-2 tax
- $1,779 · $148/mo
- Expected delta
- $0/yr ($0/mo · 0.0%)
ⓘ Screening estimate from a state-policy table — verify with the county assessor before closing.
Climate risk First Street
- Flood 1/10 Low FEMA zone X (unshaded) · 0% chance over 30 yrs
- Wildfire 1/10 Low
- Heat 6/10 Major 7 d/yr ≥101°F today · 18 d/yr by 30 yrs out
- Wind 2/10 Low 2% chance of damaging wind over 30 yrs
- Air quality 2/10 Low 0 unhealthy d/yr today · 1 by 30 yrs out
Nearby sold comps map
Loading sold comps map…
Walkable amenities ~0.75 mi
Loading nearby amenities…
Taxation est. · year 1
- Rental income
- $17,503
- − Mortgage interest
- −$10,357
- − Property taxes
- −$1,779
- − Insurance
- −$924
- − Repairs & maintenance
- −$1,400
- − Management
- −$1,400
- − Depreciation
- −$5,379
- Taxable loss
- −$3,737
- Est. tax savings @ 24.0%
- +$897
- After-tax cash flow
- $385/yr
For passive investors: Depreciation is non-cash, so a rental often shows a tax loss while cash-flowing — sheltering income. Rental losses are passive: they offset passive income freely, and up to $25,000/yr can offset ordinary (W-2) income if you actively participate and your MAGI is under $100k (phasing out to $0 by $150k); unused losses carry forward. On sale, claimed depreciation is recaptured at up to 25%, and gains may owe capital-gains tax (a 1031 exchange can defer both). Figures are a year-1 estimate at your 24.0% rate — not tax advice; consult a CPA.
Schools (NCES district)
- District
- Lynchburg City Public School District
- NCES district ID
- 5102340
- Math proficiency
- 36% ▼ -38.00%
- Reading proficiency
- 61% ▼ -8.00%
- Median HH income
- $39,097
- Composite
- 40.4/100
- National rank
- #3730
- State rank
- #104 of 131 in VA
Livability — Lynchburg
- Score
- 91/100
- State rank
- #1
- US rank
- #58
Category grades
Schools grade is shown separately in the Schools card above.
Census & demographics
- Census place
- Lynchburg, VA
- County
- Lynchburg City · 97,036 people
- City population
- 97,036
- Metro
- Lynchburg, VA
- Population (ZIP)
- 41,979
- Household income
- $68,872
- Rent vs Own
- Severe rent burden
- 1774.0
Population outlook (Lynchburg County) Hauer SSP2
- Today (2025)
- 87,977 people
- By 2030
- 93,626 · +6.4%
- By 2040
- 106,145 · +20.7%
- By 2050
- 120,783 · +37.3%
- By 2075
- 162,249 · +84.4%
- By 2100
- 191,358 · +117.5%
Race, ethnicity, and origin ACS 2023
- Neighborhood character
- Predominantly White (68%)
- Race & ethnicity
- White 68% Black 19% Two or more races 6% Hispanic / Latino 6% Asian 2%
- Hispanic origin (detail)
- Mexican 2%
- Common ancestry
- Slovak 3% Italian 2% Lithuanian 2%
- Foreign-born
- 6% · Canada, South Korea, United Kingdom
- Languages at home
- 91% English-only · Spanish 4% Other Indo-European 1% Other Asian/Pacific 1%
Political lean MEDSL · Lynchburg
- 2024 margin
- Lean R (+7.9) · D 45.4% · R 53.3% · Other 1.3%
- 2008→2024 swing
- -3.9pp toward R · 2008: -4.0pp · 2024: -7.9pp
- All cycles
- 2024: R+7.9 2020: D+2.6 2016: R+9.0 2012: R+10.6 2008: R+4.0
Not yet ingested
- Civics
- —
Market trends
- HPI YoY
- ▼ -222.79%
- Current HPI
- 241.9041
- Rent YoY
- ▲ 5.11%
- Metro
- Lynchburg, VA
- State GDP YoY
- ▲ 2.40%
- F500 in state
- 50
Industry mix (Fortune 500 HQ in VA)
| Industry | F500 HQs | Revenue |
|---|---|---|
| Aerospace / Defense | 4 | $236B |
|
||
| Technology / Defense | 3 | $32B |
|
||
| Financial Services | 2 | $176B |
|
||
| Utilities | 2 | $27B |
|
||
| Insurance | 2 | $25B |
|
||
| Technology | 2 | $15B |
|
||
Price history
+149.6% since first listed28 events — show timeline
- 2026-03-18 Listed $199,900 LMLS
- 2025-12-29 Pending — LMLS
- 2025-12-19 Price Changed $202,999 LMLS
- 2025-11-12 Price Changed $203,000 LMLS
- 2025-11-06 Price Changed $204,500 LMLS
- 2025-10-30 Price Changed $205,500 LMLS
- 2025-10-22 Price Changed $206,500 LMLS
- 2025-10-16 Price Changed $207,000 LMLS
- 2025-10-11 Price Changed $207,500 LMLS
- 2025-10-01 Price Changed $208,000 LMLS
- 2025-09-16 Price Changed $208,500 LMLS
- 2025-09-10 Price Changed $209,000 LMLS
- 2025-08-31 Price Changed $209,500 LMLS
- 2025-07-09 Price Changed $210,000 LMLS
- 2025-07-03 Price Changed $215,000 LMLS
- 2025-06-17 Price Changed $219,999 LMLS
- 2025-05-02 Price Changed $224,999 LMLS
- 2025-04-19 Relisted — LMLS
- 2025-04-08 Pending — LMLS
- 2025-02-27 Listed $225,000 LMLS
- 2022-11-09 Delisted — LMLS
- 2022-11-07 Sold (Public Records) $189,900 Public Records
- 2022-11-07 Sold (MLS) $189,900 LMLS
- 2022-09-29 Pending — LMLS
- 2022-09-14 Listed $189,900 LMLS
- 2011-10-03 Sold (Public Records) $107,900 Public Records
- 2009-12-30 Sold (Public Records) $84,500 Public Records
- 2004-07-23 Sold (Public Records) $80,100 Public Records
Property tax history
+4.9%/yrLatest (2025): $1,779 · +15.8% YoY. Source: county tax records.
Cash-flow waterfall
monthlySold comps — $/sqft
last 12 mo · ≤1 miLoading sold comps…