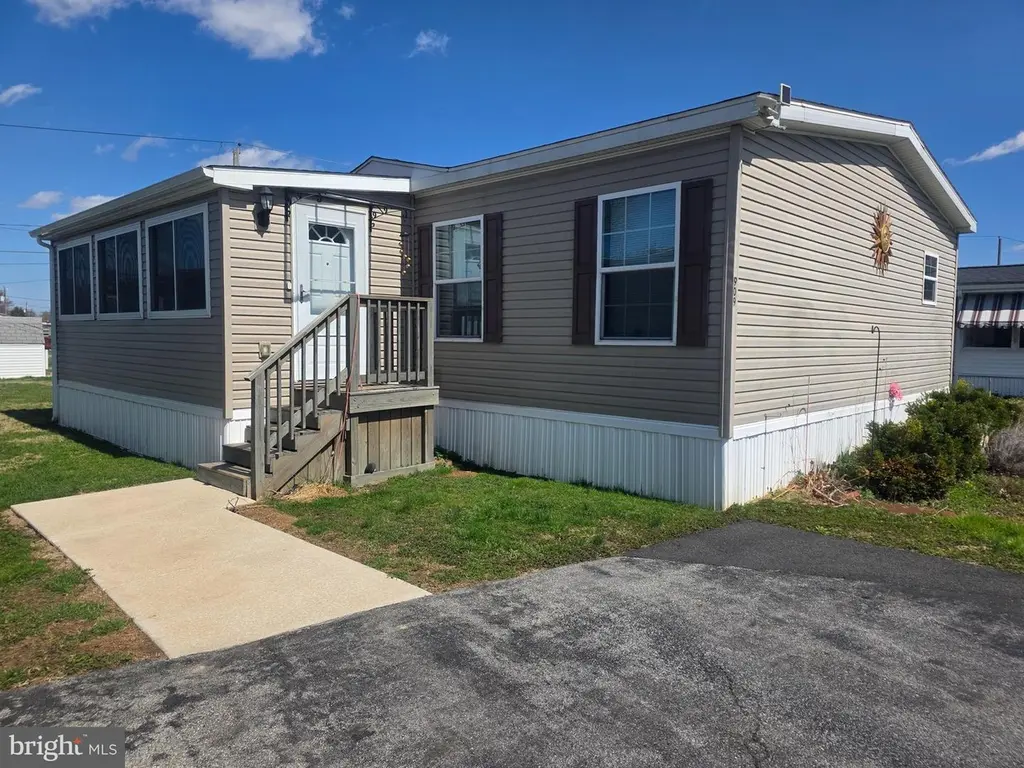
909 10th Ave #713
Pike Creek Valley, DE 19808
$132,000C+
3 bd · 2.0 ba ·
1,856 sqft ·
Built 2016
· SingleFamily
· Active
· 49 DOM
Cashflow @ list (25.0% down · 7.5%)
Estimated rent
$2,465/mo
Mortgage (P&I)
−$692
Tax + insurance
−$220
HOA
−$1
Vac / Maint / Mgmt
−$518
Net cashflow
$1,034/mo
Annual
$12,407/yr
Cap rate
15.69%
Cash-on-cash
33.57%
DSCR
2.49
1% rule
1.87%
Cash to close
$36,960
Investor read
- This is a 3-bed/2.0-bath single-family listed at $132k. Condition is rated good.
- At list price, monthly cash flow is $1k ($12k/yr) — positive.
- The deal already cash-flows at list — no discount required.
- Meets the 1% rule at list price ($2k rent vs $132k).
- It's been on market 49 days — a 3% lower offer ($128k) is reasonable based on typical stale-listing flexibility.
- Recommended offer: $128k (3.0% below list) — sets the bar for market timing.
- Local home prices are declining (-3.0%/yr); year-one equity from $913 of loan paydown is wiped out by about $4k of value loss. Plan a longer hold.
- Location reads 69/100 on livability (#26 in DE) — a middle-class / working-renter tenant base. Strengths: housing A+, employment A, cost of living B+; Watch: amenities F, commute F, health & safety D-.
- Red Clay Consolidated School District (suburban): math 27% / reading 42% proficiency, ranked #12 of 26 in DE (top 46%) — families likely to look elsewhere, expect single-tenant / working-renter base with shorter leases.
- Market conditions: Rents rising (+2.0%/yr); 126 active listings in the ZIP; 5 comparable units currently listed for rent nearby; rentals at typical pace (median 18d on market — plan ~3-4 weeks tenant-placement turnaround); solid renter incomes; 1,367 units permitted in New Castle County in 2024 (201 in 5+ unit buildings).
- New Castle County population projected at +9% by 2050 — modest demand growth; plan on rents tracking national, not racing it.
- At projected returns (-3.0% appreciation + 2.0% rent growth), your $37k cash investment doubles in ~4 years — after that, you're playing with house money.
- Cap rate 15.7% vs local median 4.7% in Pike Creek Valley — top-decile yield for the area; either an underpriced asset or a hidden risk that comps aren't pricing in. Stress-test before assuming the spread holds.
- This rent runs 31% of the median local income ($94k/yr) — at the standard rent-burdened threshold; future hikes will face affordability resistance.
Questions for listing agent
- It's been on market 49 days. Have you received any prior offers? Is the seller open to a 3% concession, seller financing, or rate buy-down credit?
- What does the HOA fee cover, when was the last increase, and are there any pending special assessments or reserve-fund shortfalls?
- Is there a deadline driving the sale (1031 exchange, divorce, estate, relocation)? That informs how much negotiation room exists.
- What's the average days-on-market for RENTAL listings here right now (not sales)? A rising rental-DOM trend means longer vacancies and softer asking-rent achievability than the comps imply.
- What's the recent tenant-quality profile in this submarket — average credit score on applications, eviction rate, late-payment / NSF rate, and stable-employment percentage? A property-management company in the area should have these aggregated.
- How much new for-sale + rental construction is in the pipeline within 1–3 miles? Heavy new supply typically softens prices + rents 12–24 months out; constrained supply supports both.
CashFlowRE · CFR-QSE9V5FEBF09B7
· Data 2 days ago
cashflowre.app · 2026-05-29