909 10th Ave #713 · Pike Creek Valley, DE
Flood risk No data
- FEMA flood zone
- —
- Chance of flooding over 30 yrs
- —
- Est. flood insurance / yr
- —
Fire risk No data
- Est. fire insurance / yr
- —
Heat risk No data
- Hot days now (above threshold)
- —
- Hot days in 30 yrs
- —
Wind risk No data
- Chance of severe wind over 30 yrs
- —
Air-quality risk No data
- Unhealthy air days now
- —
- Unhealthy air days in 30 yrs
- —
Risk factors via First Street. Map © Google.
Why this score? — see what drove the C+ grade
The composite is a weighted blend of 9 inputs, each scored 0–100. Each bar is that input's sub-score; the figure is the points it added to the 100-point composite (weight × sub-score).
- Cash flow +30.0/30.0
- 1% rule +10.0/10.0
- DSCR +10.0/10.0
- Condition / age +4.0/5.0
- Livability +3.5/5.0
- Schools +3.1/10.0
- Rent growth +3.0/5.0
- ARV discount +0.0/15.0
- Appreciation +0.0/10.0
$132,000
🖨 Deal sheet 📄 Offer letter ✓ Due diligence
Listing remarks
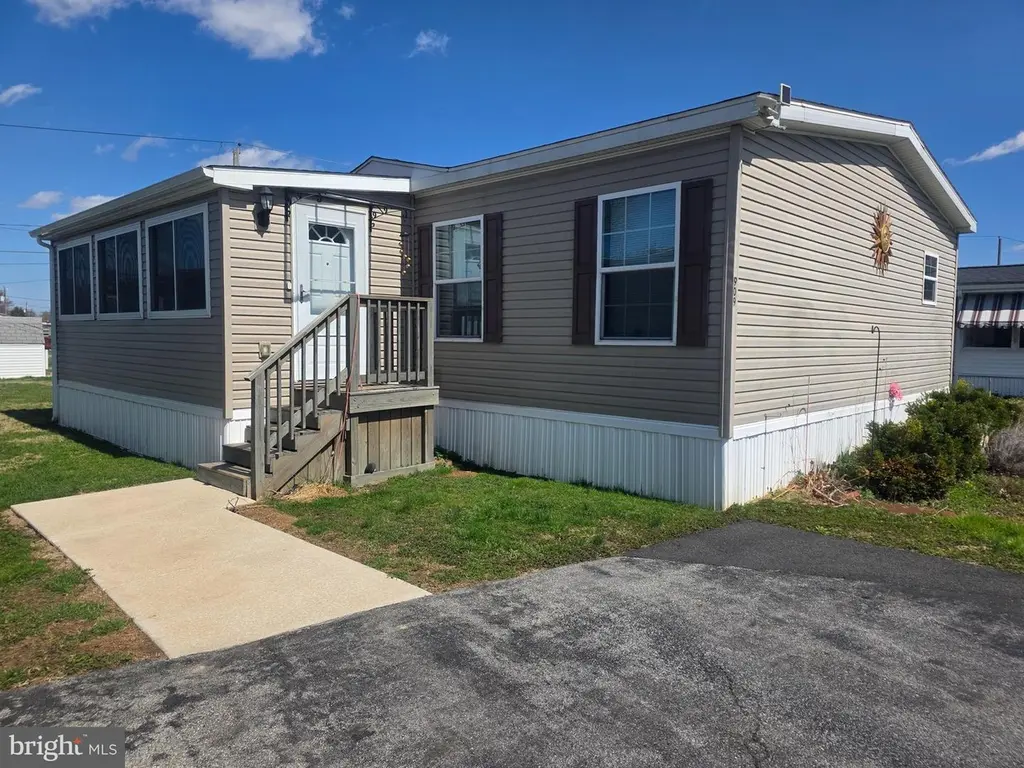
Welcome to this beautifully maintained 2016 Eagle model double-wide mobile home, offering comfort, space, and a peaceful setting. This one-owner home features 3 generously sized bedrooms and 2 full bathrooms, all in like-new condition. Step inside to an inviting eat-in kitchen, perfect for casual meals and everyday living. The spacious layout flows seamlessly into the living area, where a cozy propane fireplace creates a warm and welcoming atmosphere. A bright sunroom addition provides the ideal spot to relax, entertain, or enjoy your morning coffee while taking in the serene surroundings. Situated in a quiet, tranquil area of the community, this home offers both privacy and convenience. Wi
Key facts
- 2 parking spots
- Built 2016
- Listed 48 days
Property features AI
Finance
- Other: Property manager present
- Financial info: Land lease (ground rent) in place; Annual ground rent listed among income/expense items
- HOA & community: Annual community fee of $15
Exterior
- Parking: Driveway parking (2 spaces); Two total garage and parking spaces
- Utilities: Public water; Public sewer; 60+ gallon hot water tank; Municipal trash not provided
- Home design: Manufactured property; Double wide (approximately 28 ft by 60 ft); Architectural shingle roof
- Construction: Mixed construction with modular/manufactured components; Estimated year built
- Exterior features: Located in Murray Manor II; Ground rent exists with a monthly land lease of $1,031 (100 years remaining); Outside city limits; No tidal water
Interior
- Bedrooms: Three bedrooms on the main level
- Bathrooms: Two full bathrooms on the main level
- Heating & cooling: Forced air heating; Propane (leased) heating fuel; Central air conditioning (electric)
- Interior features: Estimated living area; One fireplace
Neighborhood map
What this means for you Summary
Snapshot
- This is a 3-bed/2.0-bath single-family listed at $132k. Condition is rated good.
Deal economics
- At list price, monthly cash flow is $1k ($12k/yr) — positive.
- The deal already cash-flows at list — no discount required.
- Meets the 1% rule at list price ($2k rent vs $132k).
- Recommended offer: $128k (3.0% below list) — sets the bar for market timing.
- Cap rate 15.7% vs local median 4.7% in Pike Creek Valley — top-decile yield for the area; either an underpriced asset or a hidden risk that comps aren't pricing in. Stress-test before assuming the spread holds.
Location & tenants
- Location reads 69/100 on livability (#26 in DE) — a middle-class / working-renter tenant base. Strengths: housing A+, employment A, cost of living B+; Watch: amenities F, commute F, health & safety D-.
- Red Clay Consolidated School District (suburban): math 27% / reading 42% proficiency, ranked #12 of 26 in DE (top 46%) — families likely to look elsewhere, expect single-tenant / working-renter base with shorter leases.
- Market conditions: Rents rising (+2.0%/yr); 126 active listings in the ZIP; 5 comparable units currently listed for rent nearby; rentals at typical pace (median 17d on market — plan ~3-4 weeks tenant-placement turnaround); solid renter incomes; 1,367 units permitted in New Castle County in 2024 (201 in 5+ unit buildings).
- This rent runs 31% of the median local income ($94k/yr) — at the standard rent-burdened threshold; future hikes will face affordability resistance.
Forward outlook
- Local home prices are declining (-3.0%/yr); year-one equity from $913 of loan paydown is wiped out by about $4k of value loss. Plan a longer hold.
- New Castle County population projected at +9% by 2050 — modest demand growth; plan on rents tracking national, not racing it.
- At projected returns (-3.0% appreciation + 2.0% rent growth), your $37k cash investment doubles in ~4 years — after that, you're playing with house money.
Negotiation context
- It's been on market 49 days — a 3% lower offer ($128k) is reasonable based on typical stale-listing flexibility.
Questions for the listing agent
- It's been on market 49 days. Have you received any prior offers? Is the seller open to a 3% concession, seller financing, or rate buy-down credit?
- What does the HOA fee cover, when was the last increase, and are there any pending special assessments or reserve-fund shortfalls?
- Is there a deadline driving the sale (1031 exchange, divorce, estate, relocation)? That informs how much negotiation room exists.
- What's the average days-on-market for RENTAL listings here right now (not sales)? A rising rental-DOM trend means longer vacancies and softer asking-rent achievability than the comps imply.
- What's the recent tenant-quality profile in this submarket — average credit score on applications, eviction rate, late-payment / NSF rate, and stable-employment percentage? A property-management company in the area should have these aggregated.
- How much new for-sale + rental construction is in the pipeline within 1–3 miles? Heavy new supply typically softens prices + rents 12–24 months out; constrained supply supports both.
Investment metrics
- 1% rule
- 1.87% ✓
- Cap rate
- 15.69%
- Cash-on-cash
- 33.57%
- DSCR
- 2.49
- GRM
- 4.5
CMA / ARV
- ARV (median comp)
- $104,508
- List price
- $132,000
- Delta
- 26.31%
- Verdict
- OVERPRICED
- Comps
- 20 within 1.0 mi
Show comp detail 12 sales within ~0.75 mi
| Address | Dist | Beds/Ba | Sqft | Sold | Price | $/sf | Match |
|---|---|---|---|---|---|---|---|
| 87 Joyce Dr | 0.07mi | 2/2.0 (-1) | 1,696 (-9%) | 1mo | $125,000 | $74 | 76 |
| 2107 Othoson Ave | 0.27mi | 3/4.0 | 1,850 (-0%) | 7mo | $489,000 | $264 | 73 |
| 1909 E Zabenko Dr | 0.32mi | 3/2.5 | 1,699 (-8%) | 0mo | $427,000 | $251 | 69 |
| 53 Marta Dr | 0.55mi | 3/1.5 | 1,925 (+4%) | 0mo | $399,900 | $208 | 66 |
| 2270 Saint James Dr | 0.58mi | 3/1.5 | 1,875 (+1%) | 7mo | $360,000 | $192 | 63 |
| 1917 W Zabenko Dr | 0.43mi | 3/1.5 | 1,975 (+6%) | 7mo | $330,000 | $167 | 61 |
| 2002 Cunningham Rd | 0.59mi | 4/2.5 (+1) | 1,875 (+1%) | 5mo | $494,000 | $263 | 60 |
| 335 Nicholas Ct | 0.56mi | 3/2.5 | 2,000 (+8%) | 2mo | $450,000 | $225 | 57 |
| 10 Alcott Dr | 0.59mi | 4/1.5 (+1) | 2,000 (+8%) | 6mo | $430,000 | $215 | 47 |
| 2603 Heritage Farm Dr | 0.68mi | 4/— (+1) | 2,025 (+9%) | 3mo | $450,000 | $222 | 46 |
| 24 Marta Dr | 0.49mi | 4/3.0 (+1) | 1,675 (-10%) | 7mo | $430,000 | $257 | 46 |
| 4803 Paulson Dr | 0.73mi | 3/2.5 | 1,675 (-10%) | 5mo | $250,000 | $149 | 43 |
Match score weights: distance 35% · size 25% · config 20% · recency 20%. Top-matched comps best support the ARV.
Projected returns pro-forma
-3.0% appreciation · 2.02% rent growth · sell at horizon
- IRR
- 27.7%
- Equity multiple
- 2.14×
- Total profit
- $42,090
- Equity at exit
- $19,682
- IRR
- 34.7%
- Equity multiple
- 4.03×
- Total profit
- $111,913
- Equity at exit
- $11,413
Cash invested: $36,960 (down + closing). Projections, not guarantees.
Landlord ↔ Tenant lean methodology
- Overall (STATE)
- 70 Landlord-Friendly
- State Delaware
- 70 Landlord-Friendly · D+7
- County
- — inherits STATE
- City
- — inherits STATE
ZIP-level market 19808
- Rents YoY
- 2.0%
- Active inventory
- 126
- Price-to-rent
- 4.5×
Monthly cashflow live
- Estimated rent
- $2,465 high interval (Pro) →
- Mortgage (P&I)
- −$692
- Tax est. 1.5%
- −$165 /mo · $1,980/yr
- Insurance
- −$55
- HOA
- −$1
- Vacancy / Maint / Mgmt
- −$518
- Net cashflow
- $1,034
Break-even live
UW: 25.0% down · 7.5% · 30yr · 1.5% tax · 5.0% vac · 8.0% maint · 8.0% mgmt
Financing live
Cash to close
- Down payment
- $33,000
- Closing costs
- $3,960
- Reserves months
- —
- Total cash needed
- —
Loan-product check · same deal, 3 products live
Conventional
25% down · 7.5% · 30yr
- Down + closing
- —
- Monthly P&I
- —
- Monthly cashflow
- —
- DSCR
- —
- Eligible?
- —
Personal DTI + credit; lowest rate.
DSCR
20% down · 8.5% · 30yr
- Down + closing
- —
- Monthly P&I
- —
- Monthly cashflow
- —
- DSCR
- —
- Eligible?
- —
No personal income docs; deal must DSCR.
Hard money
10% down · 12.0% · 12mo
- Down + closing
- —
- Monthly P&I
- —
- Monthly cashflow
- —
- DSCR
- —
- Eligible?
- —
Short-term bridge; refi at stabilization.
Rent comps 5 comps
| Address | Beds | Baths | Sqft | Rent | $/sqft | DOM | Units | Dist |
|---|---|---|---|---|---|---|---|---|
| 1916 E Zabenko Dr Wilmington, DE | 3.0 | 1.5 | 1975 | $2,450 | $1.24 | 24d | 1 | 0.41mi |
| 1921 W Zabenko Dr Wilmington, DE | 3.0 | 1.5 | 2000 | $2,500 | $1.25 | 44d | 1 | 0.44mi |
| 117 Larkspur Rd Newark, DE | 4.0 | 2.5 | 2050 | $2,800 | $1.37 | 17d | 1 | 0.89mi |
| 635 Stanton Christiana Rd Newark, DE | 4.0 | 2.0 | 1675 | $2,300 | $1.37 | 15d | 1 | 1.06mi |
| 229 E Green Valley Cir Newark, DE | 2.0 | 1.5 | 1250 | $2,050 | $1.64 | 1d | 1 | 1.15mi |
HOA detail
- Monthly dues
- $1 · $12/yr
Listing history 17 events
-
2026-06-18days on market $132,000 Active 49 DOM
-
2026-06-17days on market $132,000 Active 48 DOM
-
2026-06-16days on market $132,000 Active 47 DOM
-
2026-06-15days on market $132,000 Active 46 DOM
-
2026-06-13days on market $132,000 Active 44 DOM
-
2026-06-13days on market $132,000 Active 43 DOM
-
2026-06-09days on market $132,000 Active 40 DOM
-
2026-06-08days on market $132,000 Active 39 DOM
-
2026-06-07days on market $132,000 Active 38 DOM
-
2026-06-04days on market $132,000 Active 35 DOM
-
2026-06-03days on market $132,000 Active 34 DOM
-
2026-06-02days on market $132,000 Active 33 DOM
-
2026-06-01days on market $132,000 Active 32 DOM
-
2026-05-31days on market $132,000 Active 31 DOM
-
2026-05-06price $132,000 906-char remark
-
2026-05-01$150,000 Active 906-char remark
-
2026-04-27historical $150,000 906-char remark
ⓘ Source: listings_history table (triggers on properties + properties_extension) + one-shot
backfill from property_details.listing_events for pre-trigger history.
Nearby sold comps map
Loading sold comps map…
Walkable amenities ~0.75 mi
Loading nearby amenities…
Taxation est. · year 1
- Rental income
- $29,576
- − Mortgage interest
- −$7,394
- − Property taxes
- −$1,980
- − Insurance
- −$660
- − Repairs & maintenance
- −$2,366
- − Management
- −$2,366
- − HOA
- −$12
- − Depreciation
- −$3,840
- Taxable income
- $10,958
- Est. tax owed @ 24.0%
- −$2,630
- After-tax cash flow
- $9,777/yr
For passive investors: Depreciation is non-cash, so a rental often shows a tax loss while cash-flowing — sheltering income. Rental losses are passive: they offset passive income freely, and up to $25,000/yr can offset ordinary (W-2) income if you actively participate and your MAGI is under $100k (phasing out to $0 by $150k); unused losses carry forward. On sale, claimed depreciation is recaptured at up to 25%, and gains may owe capital-gains tax (a 1031 exchange can defer both). Figures are a year-1 estimate at your 24.0% rate — not tax advice; consult a CPA.
Condition & rehab AI · 1 photo
This 2016 Eagle model double-wide mobile home is in excellent condition with minimal maintenance needed. It offers a good ROI with updates that can significantly enhance its resale and rental value.
Value-add opportunities
- Resale Paint exterior siding — Enhances curb appeal and can add value
- Both Replace propane fireplace with electric — Improves energy efficiency and comfort
- Both Install smart home features — Attracts tech-savvy buyers and renters
Renovation cost estimate screening
Value-add ROI direction
- Resale Paint exterior siding — Enhances curb appeal and can add value ↑
- Both Replace propane fireplace with electric — Improves energy efficiency and comfort ↑
- Both Install smart home features — Attracts tech-savvy buyers and renters ↑
ⓘ Cost ranges are severity-bucket heuristics (US national rule-of-thumb). Get contractor quotes + a written scope before underwriting a rehab budget.
Schools (NCES district)
- District
- Red Clay Consolidated School District
- NCES district ID
- 1001300
- Math proficiency
- 27% ▼ -11.00%
- Reading proficiency
- 42% ▼ -7.00%
- Median HH income
- $64,298
- Composite
- 31.25/100
- National rank
- #6027
- State rank
- #12 of 26 in DE
Livability — Pike Creek Valley
- Score
- 69/100
- State rank
- #26
- US rank
- #8511
Category grades
Schools grade is shown separately in the Schools card above.
Census & demographics
- County
- New Castle County · 483,412 people
- Metro
- Philadelphia-Camden-Wilmington, PA-NJ-DE-MD
- Population (ZIP)
- 39,082
- Household income
- $94,234
- Rent vs Own
- Severe rent burden
- 619.0
Population outlook (New Castle County) Hauer SSP2
- Today (2025)
- 594,686 people
- By 2030
- 609,164 · +2.4%
- By 2040
- 632,154 · +6.3%
- By 2050
- 649,068 · +9.1%
- By 2075
- 687,771 · +15.7%
- By 2100
- 694,961 · +16.9%
Race, ethnicity, and origin ACS 2023
- Neighborhood character
- Predominantly White (66%)
- Race & ethnicity
- White 66% Hispanic / Latino 14% Asian 8% Black 8% Two or more races 7%
- Hispanic origin (detail)
- Mexican 7% Puerto Rican 3%
- Common ancestry
- Romanian 7% Lithuanian 1% Slovak 1%
- Foreign-born
- 14% · Canada, China, South Korea
- Languages at home
- 80% English-only · Spanish 12% Chinese 3% Other Indo-European 2%
Political lean MEDSL · New Castle
- 2024 margin
- Solid D (+32.6) · D 65.5% · R 32.9% · Other 1.6%
- 2008→2024 swing
- -8.1pp toward R · 2008: 40.6pp · 2024: 32.6pp
- All cycles
- 2024: D+32.6 2020: D+37.1 2016: D+29.6 2012: D+34.1 2008: D+40.6
Not yet ingested
- Civics
- —
Market trends
- HPI YoY
- ▼ -252.43%
- Current HPI
- 239.0702
- Rent YoY
- ▲ 2.02%
- Metro
- Philadelphia-Camden-Wilmington, PA-NJ-DE-MD
- State GDP YoY
- —
- F500 in state
- 0
Price history
-12.0% since first listed3 events — show timeline
- 2026-05-06 Price Changed $132,000 BRIGHT MLS
- 2026-05-01 Listed $150,000 BRIGHT MLS
- 2026-04-27 Coming Soon $150,000 BRIGHT MLS
Cash-flow waterfall
monthlySold comps — $/sqft
last 12 mo · ≤1 miLoading sold comps…