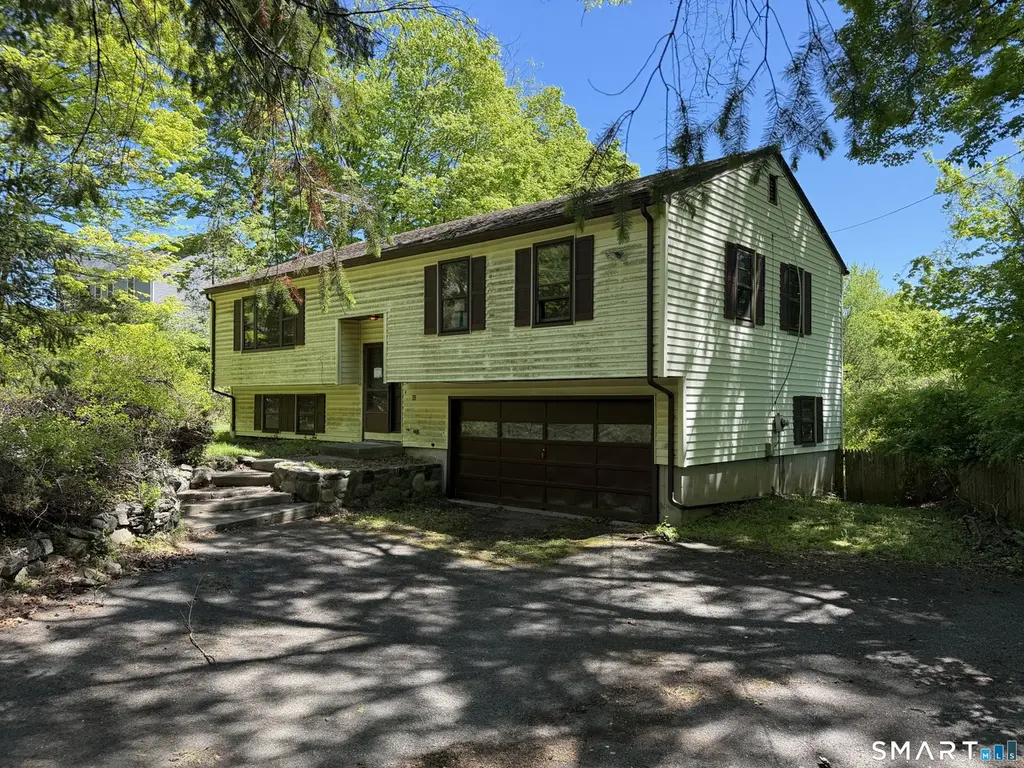
15 Bear Mountain Rd
Danbury, CT 06811
$420,000D
3 bd · 2.0 ba ·
1,236 sqft ·
Built 1976
· SingleFamily
· Active
· 36 DOM
Cashflow @ list (25.0% down · 7.5%)
Estimated rent
$3,591/mo
Mortgage (P&I)
−$2,203
Tax + insurance
−$700
HOA
−$0
Vac / Maint / Mgmt
−$754
Net cashflow
$-65/mo
Annual
$-786/yr
Cap rate
6.11%
Cash-on-cash
-0.67%
DSCR
0.97
1% rule
0.85%
Cash to close
$117,600
Investor read
- This is a 3-bed/2.0-bath single-family listed at $420k.
- At list price, monthly cash flow is $-65 ($-786/yr) — negative.
- To cash-flow at today's rent, offer at most $408k (2.8% below list).
- To meet the 1% rule (rent ≥ 1% of price), the offer needs to be $359k (14.5% below list).
- It's been on market 36 days — a 3% lower offer ($407k) is reasonable based on typical stale-listing flexibility.
- Recommended offer: $359k (14.5% below list) — sets the bar for 1% rule.
- Local home prices are declining (-3.0%/yr); year-one equity from $3k of loan paydown is wiped out by about $13k of value loss. Plan a longer hold.
- Location reads 76/100 on livability (#51 in CT, #3,379 nationally) — a middle-class / working-renter tenant base. Strengths: commute A+, housing A+, health & safety A+; Watch: schools D+, amenities F, cost of living F.
- Danbury School District (urban): math 19% / reading 32% proficiency, ranked #131 of 153 in CT (top 86%) — low school quality limits family demand, transient renter base, plan for 1-2y turnover.
- Market conditions: 121 active listings in the ZIP; 2 comparable units currently listed for rent nearby; solid renter incomes; 1,151 units permitted in Western Connecticut Planning Region in 2024 (714 in 5+ unit buildings).
- 2 sale attempts since 24y ago with the ask held roughly flat each time — persistent listings suggest the price (not the market) is what's stuck; bring a comps-based counter.
- Cap rate 6.1% vs local median 3.6% in Danbury — top-decile yield for the area; either an underpriced asset or a hidden risk that comps aren't pricing in. Stress-test before assuming the spread holds.
- This rent runs 41% of the median local income ($105k/yr) — at the standard rent-burdened threshold; future hikes will face affordability resistance.
Questions for listing agent
- What do current leases actually rent for vs. the listed asking? Can we see a recent rent roll and the last 12 months of T-12 income?
- It's been on market 36 days. Have you received any prior offers? Is the seller open to a 15% concession, seller financing, or rate buy-down credit?
- Built in 1976 — when were the roof, HVAC, electrical panel, plumbing, and water heater last replaced?
- Is there a deadline driving the sale (1031 exchange, divorce, estate, relocation)? That informs how much negotiation room exists.
- Schools are D-rated, which usually means shorter tenancies and higher turnover. Who's the typical renter profile here, and what's been the actual vacancy rate?
- The area grade is low — what's the realistic commute time and amenity access for the typical tenant pool here? Any planned neighborhood developments (good or bad) we should know about?
- What's the average days-on-market for RENTAL listings here right now (not sales)? A rising rental-DOM trend means longer vacancies and softer asking-rent achievability than the comps imply.
- What's the recent tenant-quality profile in this submarket — average credit score on applications, eviction rate, late-payment / NSF rate, and stable-employment percentage? A property-management company in the area should have these aggregated.
CashFlowRE · CFR-QTDEMC1WSY16RV
· Data 2 days ago
cashflowre.app · 2026-05-29