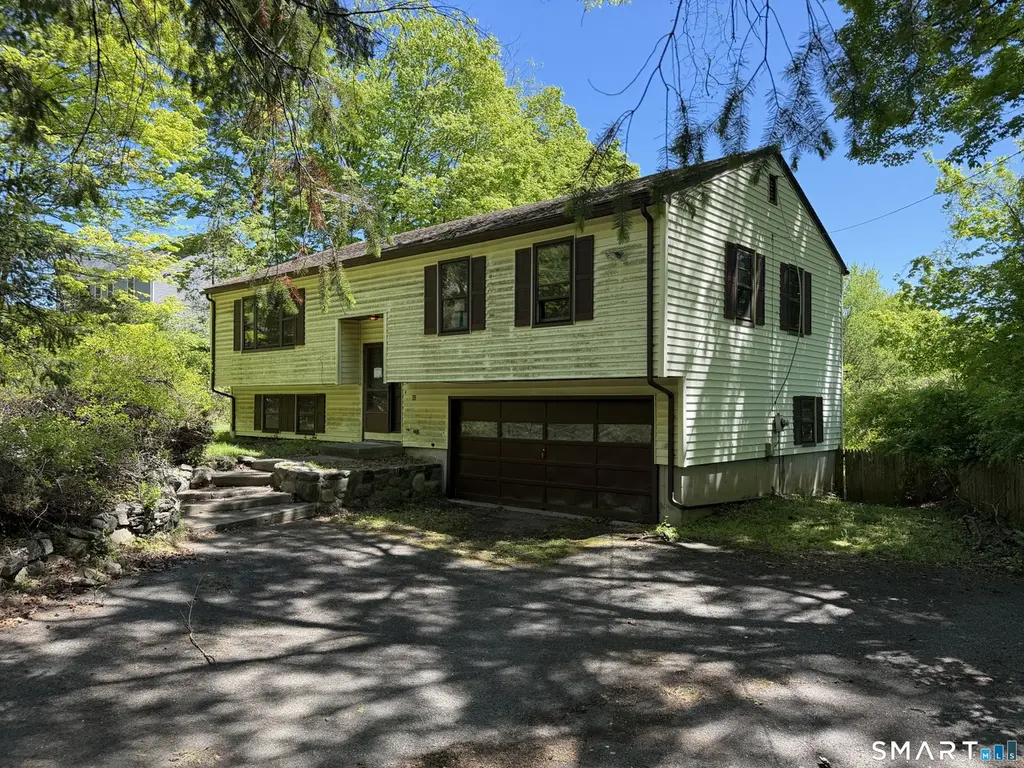
15 Bear Mountain Rd · Danbury, CT
Flood risk 1/10 · Minimal
- FEMA flood zone
- X (unshaded)
- Chance of flooding over 30 yrs
- 0.0%
- Est. flood insurance / yr
- $473 – $860
Fire risk 1/10 · Minimal
- Est. fire insurance / yr
- $829 – $1,539
Heat risk 4/10 · Minor
- Hot days now (above 98°F)
- 7 days/yr
- Hot days in 30 yrs
- 15 days/yr
Wind risk 4/10 · Minor
- Chance of severe wind over 30 yrs
- 22.0%
Air-quality risk 3/10 · Minor
- Unhealthy air days now
- 3 days/yr
- Unhealthy air days in 30 yrs
- 4 days/yr
Risk factors via First Street. Map © Google.
Why this score? — see what drove the D grade
The composite is a weighted blend of 9 inputs, each scored 0–100. Each bar is that input's sub-score; the figure is the points it added to the 100-point composite (weight × sub-score).
- Cash flow +12.4/30.0
- ARV discount +9.4/15.0
- Livability +3.8/5.0
- DSCR +3.7/10.0
- 1% rule +3.5/10.0
- Rent growth +2.5/5.0
- Condition / age +2.5/5.0
- Schools +2.4/10.0
- Appreciation +0.0/10.0
$420,000
🖨 Deal sheet 📄 Offer letter ✓ Due diligence
Listing remarks
Bring your ideas and unlock the potential of this well-located Danbury property, perfect for investors, or buyers looking to customize a home to their own style. Situated in an established neighborhood, 15 Bear Mountain Road offers a solid layout and desirable features. The home includes a primary bedroom with its own private bathroom, providing a great foundation for a comfortable retreat. The finished lower level expands the living space and features a fireplace, ideal for creating a cozy family room or entertainment area. A screened-in back porch overlooks the backyard, offering a peaceful setting with great potential for outdoor enjoyment. While the property is in need of TLC, it presen
Key facts
- Backyard
- Private bathroom
- Finished lower level
Tags
Property features AI
Exterior
- Parking: Attached garage; Two-car garage
- Utilities: Public water connected; Septic sewer
- Home design: Single-family property
- Construction: Built with frame construction; Concrete foundation; Asphalt shingle roof; Vinyl siding
- Exterior features: Screened porch; Open porch; Lightly wooded lot
Interior
- Bedrooms: Three bedrooms
- Bathrooms: Two full bathrooms
- Heating & cooling: Oil-fired baseboard heat; In-ground fuel tank
- Interior features: Seven total rooms; One fireplace; Full, partially finished basement
- Laundry & utility: Laundry on lower level; Domestic hot water
Neighborhood map
What this means for you Summary
Snapshot
- This is a 3-bed/2.0-bath single-family listed at $420k.
Deal economics
- At list price, monthly cash flow is $-65 ($-786/yr) — negative.
- To cash-flow at today's rent, offer at most $408k (2.8% below list).
- To meet the 1% rule (rent ≥ 1% of price), the offer needs to be $359k (14.5% below list).
- Recommended offer: $359k (14.5% below list) — sets the bar for 1% rule.
- Cap rate 6.1% vs local median 3.6% in Danbury — top-decile yield for the area; either an underpriced asset or a hidden risk that comps aren't pricing in. Stress-test before assuming the spread holds.
Location & tenants
- Location reads 76/100 on livability (#51 in CT, #3,379 nationally) — a middle-class / working-renter tenant base. Strengths: commute A+, housing A+, health & safety A+; Watch: schools D+, amenities F, cost of living F.
- Danbury School District (urban): math 19% / reading 32% proficiency, ranked #131 of 153 in CT (top 86%) — low school quality limits family demand, transient renter base, plan for 1-2y turnover.
- Market conditions: 121 active listings in the ZIP; 2 comparable units currently listed for rent nearby; solid renter incomes; 1,151 units permitted in Western Connecticut Planning Region in 2024 (714 in 5+ unit buildings).
- This rent runs 41% of the median local income ($105k/yr) — at the standard rent-burdened threshold; future hikes will face affordability resistance.
Forward outlook
- Local home prices are declining (-3.0%/yr); year-one equity from $3k of loan paydown is wiped out by about $13k of value loss. Plan a longer hold.
Negotiation context
- It's been on market 36 days — a 3% lower offer ($407k) is reasonable based on typical stale-listing flexibility.
- 2 sale attempts since 24y ago with the ask held roughly flat each time — persistent listings suggest the price (not the market) is what's stuck; bring a comps-based counter.
Questions for the listing agent
- What do current leases actually rent for vs. the listed asking? Can we see a recent rent roll and the last 12 months of T-12 income?
- It's been on market 36 days. Have you received any prior offers? Is the seller open to a 15% concession, seller financing, or rate buy-down credit?
- Built in 1976 — when were the roof, HVAC, electrical panel, plumbing, and water heater last replaced?
- Is there a deadline driving the sale (1031 exchange, divorce, estate, relocation)? That informs how much negotiation room exists.
- Schools are D-rated, which usually means shorter tenancies and higher turnover. Who's the typical renter profile here, and what's been the actual vacancy rate?
- The area grade is low — what's the realistic commute time and amenity access for the typical tenant pool here? Any planned neighborhood developments (good or bad) we should know about?
- What's the average days-on-market for RENTAL listings here right now (not sales)? A rising rental-DOM trend means longer vacancies and softer asking-rent achievability than the comps imply.
- What's the recent tenant-quality profile in this submarket — average credit score on applications, eviction rate, late-payment / NSF rate, and stable-employment percentage? A property-management company in the area should have these aggregated.
- How much new for-sale + rental construction is in the pipeline within 1–3 miles? Heavy new supply typically softens prices + rents 12–24 months out; constrained supply supports both.
Investment metrics
- 1% rule
- 0.85% ✗
- Cap rate
- 6.11%
- Cash-on-cash
- -0.67%
- DSCR
- 0.97
- GRM
- 9.7
CMA / ARV
- ARV (median comp)
- $438,992
- List price
- $420,000
- Delta
- -4.33%
- Verdict
- FAIR
- Comps
- 20 within 1.0 mi
Show comp detail 2 sales within ~0.75 mi
| Address | Dist | Beds/Ba | Sqft | Sold | Price | $/sf | Match |
|---|---|---|---|---|---|---|---|
| 17 Sherry Ln | 0.71mi | 3/2.5 | 1,236 (0%) | 13mo | $610,000 | $494 | 54 |
| 4 Walnut Trl | 0.40mi | 3/1.0 | 1,168 (-6%) | 18mo | $396,000 | $339 | 53 |
Match score weights: distance 35% · size 25% · config 20% · recency 20%. Top-matched comps best support the ARV.
Projected returns pro-forma
-3.0% appreciation · 3.0% rent growth · sell at horizon
- IRR
- -17.4%
- Equity multiple
- 0.39×
- Total profit
- $-72,174
- Equity at exit
- $62,623
- IRR
- -9.4%
- Equity multiple
- 0.42×
- Total profit
- $-67,999
- Equity at exit
- $36,314
Cash invested: $117,600 (down + closing). Projections, not guarantees.
Landlord ↔ Tenant lean methodology
- Overall (STATE)
- 27 Tenant-Leaning
- State Connecticut
- 27 Tenant-Leaning · D+7
- County
- — inherits STATE
- City
- — inherits STATE
ZIP-level market 06811
- Active inventory
- 121
- Price-to-rent
- 9.7×
Monthly cashflow live
- Estimated rent
- $3,591 medium interval (Pro) →
- Mortgage (P&I)
- −$2,203
- Tax from tax record
- −$525 /mo · $6,296/yr
- Insurance
- −$175
- HOA
- −$0
- Vacancy / Maint / Mgmt
- −$754
- Net cashflow
- $-65
Break-even live
Sensitivity live
| Price | -10% $172 | -5% $53 | +0% $-65 | +5% $-184 | +10% $-303 |
|---|---|---|---|---|---|
| Rent | -10% $-349 | -5% $-207 | +0% $-65 | +5% $76 | +10% $218 |
| Rate | -1.0pp $146 | -0.5pp $41 | base $-65 | +0.5pp $-174 | +1.0pp $-285 |
UW: 25.0% down · 7.5% · 30yr · 1.5% tax · 5.0% vac · 8.0% maint · 8.0% mgmt
Financing live
Cash to close
- Down payment
- $105,000
- Closing costs
- $12,600
- Reserves months
- —
- Total cash needed
- —
Loan-product check · same deal, 3 products live
Conventional
25% down · 7.5% · 30yr
- Down + closing
- —
- Monthly P&I
- —
- Monthly cashflow
- —
- DSCR
- —
- Eligible?
- —
Personal DTI + credit; lowest rate.
DSCR
20% down · 8.5% · 30yr
- Down + closing
- —
- Monthly P&I
- —
- Monthly cashflow
- —
- DSCR
- —
- Eligible?
- —
No personal income docs; deal must DSCR.
Hard money
10% down · 12.0% · 12mo
- Down + closing
- —
- Monthly P&I
- —
- Monthly cashflow
- —
- DSCR
- —
- Eligible?
- —
Short-term bridge; refi at stabilization.
Rent comps 2 comps
| Address | Beds | Baths | Sqft | Rent | $/sqft | DOM | Units | Dist |
|---|---|---|---|---|---|---|---|---|
| 8 Mendes Rd Danbury, CT | 3.0 | 1.5 | 1184 | $3,800 | $3.21 | 19d | 1 | 0.09mi |
| 6 Brighton St Danbury, CT | 3.0 | 2.5 | 1272 | $4,700 | $3.69 | 44d | 1 | 1.12mi |
Listing history 17 events
-
2026-06-18days on market $420,000 Active 36 DOM
-
2026-06-17days on market $420,000 Active 35 DOM
-
2026-06-16days on market $420,000 Active 34 DOM
-
2026-06-15days on market $420,000 Active 33 DOM
-
2026-06-13days on market $420,000 Active 31 DOM
-
2026-06-10days on market $420,000 Active 28 DOM
-
2026-06-09days on market $420,000 Active 27 DOM
-
2026-06-08days on market $420,000 Active 26 DOM
-
2026-06-07days on market $420,000 Active 25 DOM
-
2026-06-05days on market $420,000 Active 22 DOM
-
2026-06-03days on market $420,000 Active 21 DOM
-
2026-06-03days on market $420,000 Active 20 DOM
-
2026-06-01days on market $420,000 Active 19 DOM
-
2026-05-31days on market $420,000 Active 18 DOM
-
2026-05-11$420,000 Active 881-char remark
-
2002-04-01historical
-
2002-02-01$249,500
ⓘ Source: listings_history table (triggers on properties + properties_extension) + one-shot
backfill from property_details.listing_events for pre-trigger history.
Tax reassessment forecast CT · Partial reset (capped growth)
- Current annual tax
- $6,296 · $525/mo
- Projected year-2 tax
- $7,642 · $637/mo
- Expected delta
- +$1,346/yr (+$112/mo · 21.4%)
ⓘ Screening estimate from a state-policy table — verify with the county assessor before closing.
Climate risk First Street
- Flood 1/10 Low FEMA zone X (unshaded) · 0% chance over 30 yrs
- Wildfire 1/10 Low
- Heat 4/10 Moderate 7 d/yr ≥98°F today · 15 d/yr by 30 yrs out
- Wind 4/10 Moderate 22% chance of damaging wind over 30 yrs
- Air quality 3/10 Moderate 3 unhealthy d/yr today · 4 by 30 yrs out
Nearby sold comps map
Loading sold comps map…
Walkable amenities ~0.75 mi
Loading nearby amenities…
Taxation est. · year 1
- Rental income
- $43,089
- − Mortgage interest
- −$23,527
- − Property taxes
- −$6,296
- − Insurance
- −$2,100
- − Repairs & maintenance
- −$3,447
- − Management
- −$3,447
- − Depreciation
- −$12,218
- Taxable loss
- −$7,946
- Est. tax savings @ 24.0%
- +$1,907
- After-tax cash flow
- $1,121/yr
For passive investors: Depreciation is non-cash, so a rental often shows a tax loss while cash-flowing — sheltering income. Rental losses are passive: they offset passive income freely, and up to $25,000/yr can offset ordinary (W-2) income if you actively participate and your MAGI is under $100k (phasing out to $0 by $150k); unused losses carry forward. On sale, claimed depreciation is recaptured at up to 25%, and gains may owe capital-gains tax (a 1031 exchange can defer both). Figures are a year-1 estimate at your 24.0% rate — not tax advice; consult a CPA.
Schools (NCES district)
- District
- Danbury School District
- NCES district ID
- 0901020
- Math proficiency
- 19% ▼ -17.00%
- Reading proficiency
- 32% ▼ -16.00%
- Median HH income
- $65,793
- Composite
- 23.93/100
- National rank
- #7784
- State rank
- #131 of 153 in CT
Livability — Danbury
- Score
- 76/100
- State rank
- #51
- US rank
- #3379
Category grades
Schools grade is shown separately in the Schools card above.
Census & demographics
- Census place
- Danbury, CT
- County
- Fairfield County · 765,532 people
- City population
- 87,061
- Metro
- Bridgeport-Stamford-Norwalk, CT
- Population (ZIP)
- 31,228
- Household income
- $104,640
- Rent vs Own
- Severe rent burden
- 551.0
Population outlook (Western Connecticut County) Hauer SSP2
- By 2040
- 685,031
Race, ethnicity, and origin ACS 2023
- Neighborhood character
- Diverse neighborhood (Simpson 0.59)
- Race & ethnicity
- White 60% Hispanic / Latino 19% Two or more races 10% Black 10% Asian 5%
- Hispanic origin (detail)
- Mexican 2% Puerto Rican 3% Dominican 6%
- Common ancestry
- Russian 4% Romanian 3% Estonian 3%
- Foreign-born
- 23% · Canada, Guatemala, China
- Languages at home
- 67% English-only · Spanish 16% Other Indo-European 8% Russian/Polish/Slavic 2%
Political lean MEDSL · Western Connecticut
- 2024 margin
- D (+19.1) · D 58.8% · R 39.7% · Other 1.6%
- All cycles
- 2024: D+19.1
Not yet ingested
- Civics
- —
Market trends
- HPI YoY
- ▼ -361.68%
- Current HPI
- 258.6639
- Rent YoY
- —
- Metro
- Bridgeport-Stamford-Norwalk, CT
- State GDP YoY
- ▲ 1.06%
- F500 in state
- 38
Industry mix (Fortune 500 HQ in CT)
| Industry | F500 HQs | Revenue |
|---|---|---|
| Industrial Machinery | 4 | $38B |
|
||
| Insurance | 3 | $71B |
|
||
| Financial Services | 2 | $25B |
|
||
| Transportation / Logistics | 2 | $18B |
|
||
| Healthcare | 1 | $247B |
|
||
| Telecommunications | 1 | $55B |
|
||
Price history
+68.3% since first listed3 events — show timeline
- 2026-05-11 Listed $420,000 Smart MLS
- 2002-04-01 Listing Removed — Smart MLS
- 2002-02-01 Listed $249,500 Smart MLS
Property tax history
+2.8%/yrLatest (2023): $6,296 · +17.0% YoY. Source: county tax records.
Cash-flow waterfall
monthlySold comps — $/sqft
last 12 mo · ≤1 miLoading sold comps…