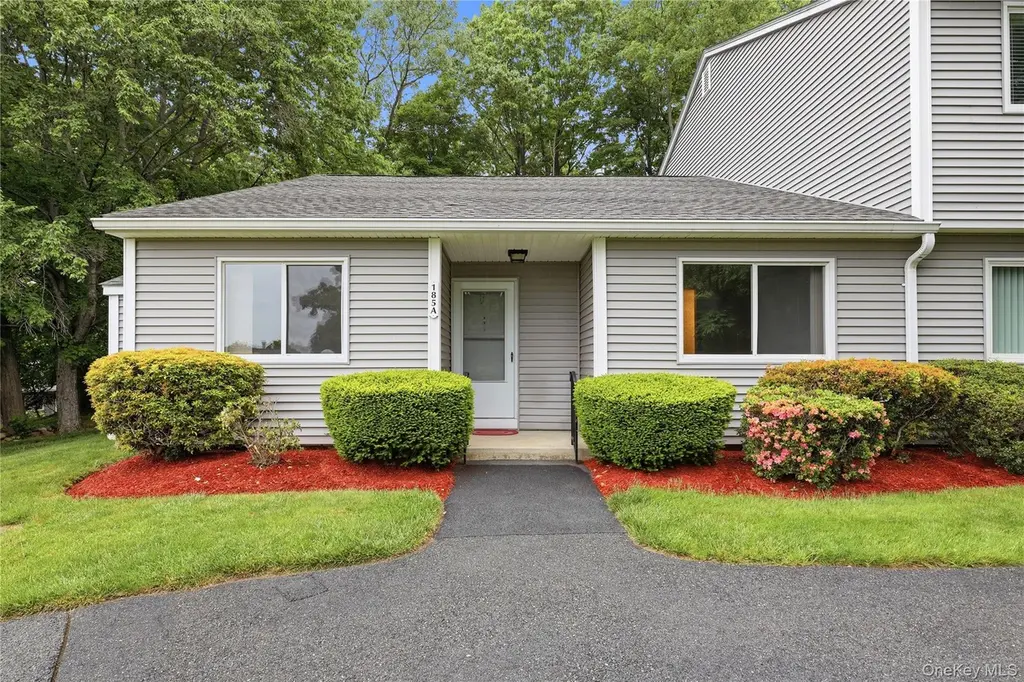
185 Long Hill Dr Unit A
Jefferson Valley-Yorktown, NY 10598
$449,000D-
2 bd · 2.0 ba ·
1,302 sqft ·
Built 1988
· Condo
· Pending
· 6 DOM
Cashflow @ list (25.0% down · 7.5%)
Estimated rent
$3,868/mo
Mortgage (P&I)
−$2,355
Tax + insurance
−$293
HOA
−$522
Vac / Maint / Mgmt
−$812
Net cashflow
$-114/mo
Annual
$-1,369/yr
Cap rate
5.99%
Cash-on-cash
-1.09%
DSCR
0.95
1% rule
0.86%
Cash to close
$125,720
Investor read
- This is a 2-bed/2.0-bath condo listed at $449k.
- At list price, monthly cash flow is $-114 ($-1k/yr) — negative.
- To cash-flow at today's rent, offer at most $429k (4.5% below list).
- To meet the 1% rule (rent ≥ 1% of price), the offer needs to be $387k (13.9% below list).
- Only 6 days on market — expect competitive offers; lowballing is unlikely to land.
- Recommended offer: $387k (13.9% below list) — sets the bar for 1% rule.
- Local home prices are declining (-3.0%/yr); year-one equity from $3k of loan paydown is wiped out by about $13k of value loss. Plan a longer hold.
- Location reads: area grade D — affects rentability + tenant quality, not the cash-flow math above.
- Lakeland Central School District (suburban): math 60% / reading 70% proficiency, ranked #149 of 590 in NY (top 25%) — acceptable for families but not a draw, mixed tenant base, ~2y average lease; only 12% free/reduced lunch — higher-income household profile.
- Zoned schools: Thomas Jefferson Elementary School (math 62% / reading 77%, grade A-, #447 of 2,108 statewide, top 24%, 399 students, 16% FRL); Lakeland-Copper Beech Middle School (math 38% / reading 66%, grade C+, #241 of 729 statewide, top 35%, 1,247 students, 29% FRL); Lakeland High School (math 94% / reading 77%, grade A, #366 of 1,100 statewide, top 33%, 942 students, 0% FRL) — zoned schools at 15% FRL track the district average.
- Market conditions: 160 active listings in the ZIP; 2 comparable units currently listed for rent nearby; 954 units permitted in Westchester County in 2024 (649 in 5+ unit buildings).
- Westchester County population projected at +10% by 2050 — modest demand growth; plan on rents tracking national, not racing it.
- Climate carrying-cost: moderate flood risk; extreme-heat days projected 7→15/yr by 2055 (HVAC capex compounding) — expect insurance premiums to compound above CPI over the hold.
- Cap rate 6.0% vs local median 2.8% in Jefferson Valley-Yorktown — top-decile yield for the area; either an underpriced asset or a hidden risk that comps aren't pricing in. Stress-test before assuming the spread holds.
Questions for listing agent
- What do current leases actually rent for vs. the listed asking? Can we see a recent rent roll and the last 12 months of T-12 income?
- What does the HOA fee cover, when was the last increase, and are there any pending special assessments or reserve-fund shortfalls?
- Any open or pending special assessments — roof, HVAC, plumbing, elevator, façade? What's the per-unit balance and payoff schedule, and is the seller paying it off at close or rolling it to the buyer?
- Is there a deadline driving the sale (1031 exchange, divorce, estate, relocation)? That informs how much negotiation room exists.
- The area grade is low — what's the realistic commute time and amenity access for the typical tenant pool here? Any planned neighborhood developments (good or bad) we should know about?
- What's the average days-on-market for RENTAL listings here right now (not sales)? A rising rental-DOM trend means longer vacancies and softer asking-rent achievability than the comps imply.
- What's the recent tenant-quality profile in this submarket — average credit score on applications, eviction rate, late-payment / NSF rate, and stable-employment percentage? A property-management company in the area should have these aggregated.
- How much new apartment / multifamily construction is in the pipeline within 1–3 miles? Heavy new supply (>2% of stock underway) typically softens rents 12–24 months out; light construction supports rent growth.
CashFlowRE · CFR-QTXAVH9ERRPHVR
· Data 6 days ago
cashflowre.app · 2026-05-29