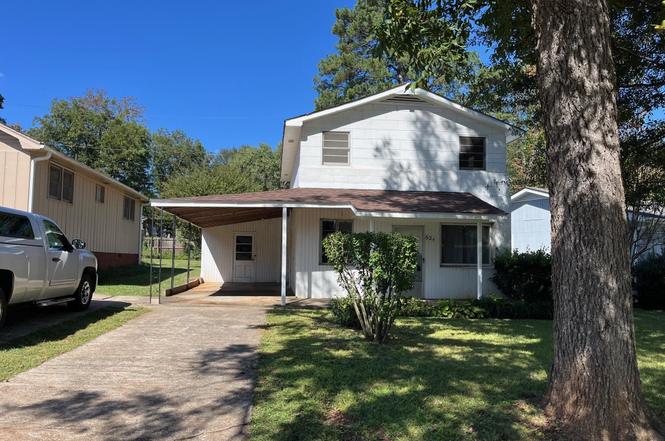
624 Old Whitney Rd
Whitney, SC 29303
$139,900C-
2 bd · 1.0 ba ·
1,020 sqft ·
Built 1950
· SingleFamily
· Active
· 254 DOM
Cashflow @ list (25.0% down · 7.5%)
Estimated rent
$1,333/mo
Mortgage (P&I)
−$734
Tax + insurance
−$166
HOA
−$0
Vac / Maint / Mgmt
−$280
Net cashflow
$153/mo
Annual
$1,838/yr
Cap rate
7.61%
Cash-on-cash
4.69%
DSCR
1.21
1% rule
0.95%
Cash to close
$39,172
Investor read
- This is a 2-bed/1.0-bath single-family listed at $140k.
- At list price, monthly cash flow is $153 ($2k/yr) — positive.
- The deal already cash-flows at list — no discount required.
- To meet the 1% rule (rent ≥ 1% of price), the offer needs to be $133k (4.7% below list).
- It's been on market 254 days — a 12% lower offer ($123k) is reasonable based on typical stale-listing flexibility.
- Recommended offer: $123k (12.0% below list) — sets the bar for market timing.
- Local home prices are declining (-3.0%/yr); year-one equity from $967 of loan paydown is wiped out by about $4k of value loss. Plan a longer hold.
- Location reads: area grade C — affects rentability + tenant quality, not the cash-flow math above.
- Spartanburg 07 (urban): math 34% / reading 41% proficiency, ranked #39 of 80 in SC (top 49%) — families likely to look elsewhere, expect single-tenant / working-renter base with shorter leases; 62% free/reduced lunch — lower-income household profile, screen leases tightly.
- Zoned schools: Mary H. Wright Elementary (math 22% / reading 22%, grade F, #475 of 597 statewide, top 81%, 455 students, 100% FRL); Spartanburg High (math 67% / reading 79%, grade B+, #44 of 196 statewide, top 23%, 2,056 students, 85% FRL) — zoned schools average 93% FRL vs 62% district-wide (31 pts higher); higher-poverty schools than district average — tighter screening recommended.
- Watch-outs: built in 1950 — expect roof / HVAC / electrical / plumbing capex.
- Market conditions: Rents rising (+3.7%/yr); 378 active listings in the ZIP; 10 comparable units currently listed for rent nearby; rentals at typical pace (median 21d on market — plan ~3-4 weeks tenant-placement turnaround); 3,129 units permitted in Spartanburg County in 2024 (40 in 5+ unit buildings).
- Spartanburg County population projected at +18% by 2050 — long-run rental-demand tailwind backs the buy-and-hold thesis.
- Cap rate 7.6% vs local median 3.9% in Whitney — top-decile yield for the area; either an underpriced asset or a hidden risk that comps aren't pricing in. Stress-test before assuming the spread holds.
- This rent runs 33% of the median local income ($48k/yr) — at the standard rent-burdened threshold; future hikes will face affordability resistance.
Questions for listing agent
- It's been on market 254 days. Have you received any prior offers? Is the seller open to a 12% concession, seller financing, or rate buy-down credit?
- Built in 1950 — when were the roof, HVAC, electrical panel, plumbing, and water heater last replaced?
- Why hasn't it sold? Are there any deal-killer items the seller is aware of (foundation, flood, title, zoning, code violations)?
- Is there a deadline driving the sale (1031 exchange, divorce, estate, relocation)? That informs how much negotiation room exists.
- What's the average days-on-market for RENTAL listings here right now (not sales)? A rising rental-DOM trend means longer vacancies and softer asking-rent achievability than the comps imply.
- What's the recent tenant-quality profile in this submarket — average credit score on applications, eviction rate, late-payment / NSF rate, and stable-employment percentage? A property-management company in the area should have these aggregated.
- How much new for-sale + rental construction is in the pipeline within 1–3 miles? Heavy new supply typically softens prices + rents 12–24 months out; constrained supply supports both.
CashFlowRE · CFR-QY5APRANPAPAXR
· Data 2 days ago
cashflowre.app · 2026-05-29