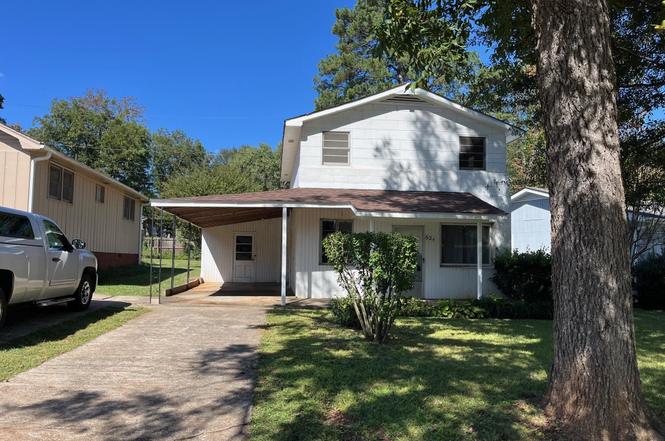
624 Old Whitney Rd · Whitney, SC
Flood risk No data
- FEMA flood zone
- —
- Chance of flooding over 30 yrs
- —
- Est. flood insurance / yr
- —
Fire risk No data
- Est. fire insurance / yr
- —
Heat risk No data
- Hot days now (above threshold)
- —
- Hot days in 30 yrs
- —
Wind risk No data
- Chance of severe wind over 30 yrs
- —
Air-quality risk No data
- Unhealthy air days now
- —
- Unhealthy air days in 30 yrs
- —
Risk factors via First Street. Map © Google.
Why this score? — see what drove the C- grade
The composite is a weighted blend of 9 inputs, each scored 0–100. Each bar is that input's sub-score; the figure is the points it added to the 100-point composite (weight × sub-score).
- Cash flow +19.3/30.0
- ARV discount +11.9/15.0
- DSCR +6.1/10.0
- 1% rule +4.5/10.0
- Rent growth +3.4/5.0
- Schools +3.1/10.0
- Livability +2.5/5.0
- Condition / age +2.5/5.0
- Appreciation +0.0/10.0
$139,900
🖨 Deal sheet 📄 Offer letter ✓ Due diligence
Listing remarks
Handyman Special! Hugely discounted! Location, Location, Location! Ready to live in while you work on it! Oh how peaceful of an area! You will love it! This is a nice quieter area so close to everything! Also, it would be ideal for a fix-and-flip or keep as a long-term rental! Located right off Hwy 221/David Pearson Blvd. , close to the hospital, I-85, Hwy 9, restaurants, stores, city bus lines but NOT in the city and NOT in a HOA area! This well-established 2-story has a Pecan and Oak tree in front, hostas and monkey grass in landscaping at front of porch, 2 Rose of Sharon bushes, 2 Crepe Myrtle trees, and other beautiful plantings, this solidly built home is ready for it's new own
Key facts
- Close to hospital
- Close to i-85
- Large full bath
Tags
Property features AI
Exterior
- Parking: Attached garage; Carport; Workshop in garage; 1 garage space
- Utilities: Cable available; Septic tank
- Home design: Single family residence; Two levels; Residential property
- Construction: Shingle siding; Wood siding; Block construction; Slab foundation; Built area above grade: 1,200
- Exterior features: Porch; Storage
Interior
- Kitchen: Electric cooktop; Electric oven; Free-standing range; Electric water heater
- Flooring: Carpet; Hardwood
- Bathrooms: 1 full bathroom; 1 half bathroom
- Heating & cooling: Has heating: Electric and Propane (see remarks); No central cooling
- Interior features: Walk-in closet(s)
- Laundry & utility: Washer hookup on main level; Electric dryer hookup; Laundry in garage
Neighborhood map
What this means for you Summary
Snapshot
- This is a 2-bed/1.0-bath single-family listed at $140k.
Deal economics
- At list price, monthly cash flow is $153 ($2k/yr) — positive.
- The deal already cash-flows at list — no discount required.
- To meet the 1% rule (rent ≥ 1% of price), the offer needs to be $133k (4.7% below list).
- Recommended offer: $123k (12.0% below list) — sets the bar for market timing.
- Cap rate 7.6% vs local median 3.9% in Whitney — top-decile yield for the area; either an underpriced asset or a hidden risk that comps aren't pricing in. Stress-test before assuming the spread holds.
Location & tenants
- Location reads: area grade C — affects rentability + tenant quality, not the cash-flow math above.
- Spartanburg 07 (urban): math 34% / reading 41% proficiency, ranked #39 of 80 in SC (top 49%) — families likely to look elsewhere, expect single-tenant / working-renter base with shorter leases; 62% free/reduced lunch — lower-income household profile, screen leases tightly.
- Zoned schools: Mary H. Wright Elementary (math 22% / reading 22%, grade F, #475 of 597 statewide, top 81%, 455 students, 100% FRL); Spartanburg High (math 67% / reading 79%, grade B+, #44 of 196 statewide, top 23%, 2,056 students, 85% FRL) — zoned schools average 93% FRL vs 62% district-wide (31 pts higher); higher-poverty schools than district average — tighter screening recommended.
- Market conditions: Rents rising (+3.7%/yr); 378 active listings in the ZIP; 10 comparable units currently listed for rent nearby; rentals at typical pace (median 21d on market — plan ~3-4 weeks tenant-placement turnaround); 3,129 units permitted in Spartanburg County in 2024 (40 in 5+ unit buildings).
- This rent runs 33% of the median local income ($48k/yr) — at the standard rent-burdened threshold; future hikes will face affordability resistance.
Forward outlook
- Local home prices are declining (-3.0%/yr); year-one equity from $967 of loan paydown is wiped out by about $4k of value loss. Plan a longer hold.
- Spartanburg County population projected at +18% by 2050 — long-run rental-demand tailwind backs the buy-and-hold thesis.
Negotiation context
- It's been on market 254 days — a 12% lower offer ($123k) is reasonable based on typical stale-listing flexibility.
Risks & watch-outs
- Watch-outs: built in 1950 — expect roof / HVAC / electrical / plumbing capex.
Questions for the listing agent
- It's been on market 254 days. Have you received any prior offers? Is the seller open to a 12% concession, seller financing, or rate buy-down credit?
- Built in 1950 — when were the roof, HVAC, electrical panel, plumbing, and water heater last replaced?
- Why hasn't it sold? Are there any deal-killer items the seller is aware of (foundation, flood, title, zoning, code violations)?
- Is there a deadline driving the sale (1031 exchange, divorce, estate, relocation)? That informs how much negotiation room exists.
- What's the average days-on-market for RENTAL listings here right now (not sales)? A rising rental-DOM trend means longer vacancies and softer asking-rent achievability than the comps imply.
- What's the recent tenant-quality profile in this submarket — average credit score on applications, eviction rate, late-payment / NSF rate, and stable-employment percentage? A property-management company in the area should have these aggregated.
- How much new for-sale + rental construction is in the pipeline within 1–3 miles? Heavy new supply typically softens prices + rents 12–24 months out; constrained supply supports both.
Investment metrics
- 1% rule
- 0.95% ✗
- Cap rate
- 7.61%
- Cash-on-cash
- 4.69%
- DSCR
- 1.21
- GRM
- 8.7
CMA / ARV
- ARV (on-the-fly)
- $155,040
- Comps found
- 12
Show comp detail 12 sales within ~0.75 mi
| Address | Dist | Beds/Ba | Sqft | Sold | Price | $/sf | Match |
|---|---|---|---|---|---|---|---|
| 323 Mulligan St | 0.15mi | 2/1.0 | 1,022 (+0%) | 6mo | $155,000 | $152 | 88 |
| 411 Rose St | 0.39mi | 2/2.0 | 1,058 (+4%) | 2mo | $159,900 | $151 | 70 |
| 234 California Ave | 0.30mi | 2/1.0 | 950 (-7%) | 12mo | $120,000 | $126 | 64 |
| 494 Longview Dr | 0.40mi | 2/1.0 | 945 (-7%) | 9mo | $120,000 | $127 | 62 |
| 667 Old Whitney Rd | 0.16mi | 2/2.0 | 868 (-15%) | 10mo | $180,000 | $207 | 56 |
| 14 Damson St | 0.47mi | 2/1.0 | 1,160 (+14%) | 0mo | $165,000 | $142 | 55 |
| 813 Hillwood Ave Ave | 0.48mi | 3/1.0 (+1) | 1,164 (+14%) | 0mo | $147,500 | $127 | 49 |
| 229 Grandview Dr | 0.62mi | 3/1.0 (+1) | 1,120 (+10%) | 2mo | $169,900 | $152 | 48 |
| 1068 Crosby Ln | 0.61mi | 3/1.0 (+1) | 906 (-11%) | 2mo | $148,732 | $164 | 46 |
| 1076 Mayfair St | 0.73mi | 3/1.0 (+1) | 1,111 (+9%) | 3mo | $179,000 | $161 | 43 |
| 711 Springhill Ave | 0.47mi | 3/2.0 (+1) | 1,170 (+15%) | 3mo | $204,900 | $175 | 42 |
| 1062 Jenkins St | 0.73mi | 2/1.0 | 1,159 (+14%) | 10mo | $207,000 | $179 | 35 |
Match score weights: distance 35% · size 25% · config 20% · recency 20%. Top-matched comps best support the ARV.
Projected returns pro-forma
-3.0% appreciation · 3.69% rent growth · sell at horizon
- IRR
- -8.3%
- Equity multiple
- 0.69×
- Total profit
- $-12,002
- Equity at exit
- $20,860
- IRR
- 2.1%
- Equity multiple
- 1.15×
- Total profit
- $5,906
- Equity at exit
- $12,096
Cash invested: $39,172 (down + closing). Projections, not guarantees.
Landlord ↔ Tenant lean methodology
- Overall (STATE)
- 90 Strongly Landlord-Friendly
- State South Carolina
- 90 Strongly Landlord-Friendly · R+6
- County
- — inherits STATE
- City
- — inherits STATE
ZIP-level market 29303
- Home prices YoY
- -14.1%
- Rents YoY
- 3.7%
- Active inventory
- 378
- Price-to-rent
- 8.7×
Monthly cashflow live
- Estimated rent
- $1,333 high interval (Pro) →
- Mortgage (P&I)
- −$734
- Tax from tax record
- −$108 /mo · $1,297/yr
- Insurance
- −$58
- HOA
- −$0
- Vacancy / Maint / Mgmt
- −$280
- Net cashflow
- $153
Break-even live
UW: 25.0% down · 7.5% · 30yr · 1.5% tax · 5.0% vac · 8.0% maint · 8.0% mgmt
Financing live
Cash to close
- Down payment
- $34,975
- Closing costs
- $4,197
- Reserves months
- —
- Total cash needed
- —
Loan-product check · same deal, 3 products live
Conventional
25% down · 7.5% · 30yr
- Down + closing
- —
- Monthly P&I
- —
- Monthly cashflow
- —
- DSCR
- —
- Eligible?
- —
Personal DTI + credit; lowest rate.
DSCR
20% down · 8.5% · 30yr
- Down + closing
- —
- Monthly P&I
- —
- Monthly cashflow
- —
- DSCR
- —
- Eligible?
- —
No personal income docs; deal must DSCR.
Hard money
10% down · 12.0% · 12mo
- Down + closing
- —
- Monthly P&I
- —
- Monthly cashflow
- —
- DSCR
- —
- Eligible?
- —
Short-term bridge; refi at stabilization.
Rent comps 10 comps
| Address | Beds | Baths | Sqft | Rent | $/sqft | DOM | Units | Dist |
|---|---|---|---|---|---|---|---|---|
| 731 Old Whitney Rd Spartanburg, SC | 3.0 | 2.5 | 1450 | $1,700 | $1.17 | 13d | 1 | 0.30mi |
| 121 Garner Rd Spartanburg, SC | 1.0–2.0 | 1.0–2.0 | 940 | $1,465 | $1.56 | 21d | 32 | 0.69mi |
| 320 Spruce St Spartanburg, SC | 1.0–3.0 | 1.0–1.5 | 830 | $962 | $1.16 | 21d | 1 | 0.84mi |
| 3900 Taggart Dr Spartanburg, SC | 1.0–3.0 | 1.0–2.0 | 854 | $1,148 | $1.34 | 21d | 3 | 1.25mi |
| 692 Southern St Spartanburg, SC | 2.0 | 1.0 | 1000 | $1,100 | $1.10 | 13d | 1 | 1.27mi |
| 560 Magnolia St Spartanburg, SC | 2.0 | 1.0 | 965 | $1,113 | $1.15 | 21d | 1 | 1.33mi |
| 753A Leonard St Spartanburg, SC | 2.0 | 1.0 | 1130 | $1,185 | $1.05 | 13d | 1 | 1.35mi |
| 119 Bonner Rd Spartanburg, SC | 2.0 | 1.0 | 900 | $845 | $0.94 | 21d | 1 | 1.42mi |
| 1214 Spring St Spartanburg, SC | 3.0 | 1.0 | 1362 | $1,395 | $1.02 | 13d | 1 | 1.44mi |
| 131 College St Spartanburg, SC | 2.0 | 1.0 | 700 | $1,195 | $1.71 | 21d | 1 | 1.49mi |
Listing history 20 events
-
2026-06-18days on market $139,900 Active 254 DOM
-
2026-06-17days on market $139,900 Active 253 DOM
-
2026-06-16days on market $139,900 Active 252 DOM
-
2026-06-15days on market $139,900 Active 251 DOM
-
2026-06-14days on market $139,900 Active 249 DOM
-
2026-06-13days on market $139,900 Active 248 DOM
-
2026-06-10days on market $139,900 Active 246 DOM
-
2026-06-09days on market $139,900 Active 245 DOM
-
2026-06-08days on market $139,900 Active 244 DOM
-
2026-06-07days on market $139,900 Active 243 DOM
-
2026-06-02days on market $139,900 Active 238 DOM
-
2026-06-01days on market $139,900 Active 237 DOM
-
2026-05-31days on market $139,900 Active 236 DOM
-
2026-05-30days on market $139,900 Active 235 DOM
-
2026-04-03price $139,900
-
2026-03-11price $144,900
-
2026-03-06price $159,900
-
2025-11-26price $149,900
-
2025-11-15price $154,900
-
2025-10-07$159,000 Active
ⓘ Source: listings_history table (triggers on properties + properties_extension) + one-shot
backfill from property_details.listing_events for pre-trigger history.
Tax reassessment forecast SC · Resets to sale price
- Current annual tax
- $1,297 · $108/mo
- Projected year-2 tax
- $1,297 · $108/mo
- Expected delta
- $0/yr ($0/mo · 0.0%)
ⓘ Screening estimate from a state-policy table — verify with the county assessor before closing.
Nearby sold comps map
Loading sold comps map…
Walkable amenities ~0.75 mi
Loading nearby amenities…
Taxation est. · year 1
- Rental income
- $15,998
- − Mortgage interest
- −$7,837
- − Property taxes
- −$1,297
- − Insurance
- −$700
- − Repairs & maintenance
- −$1,280
- − Management
- −$1,280
- − Depreciation
- −$4,070
- Taxable loss
- −$464
- Est. tax savings @ 24.0%
- +$111
- After-tax cash flow
- $1,950/yr
For passive investors: Depreciation is non-cash, so a rental often shows a tax loss while cash-flowing — sheltering income. Rental losses are passive: they offset passive income freely, and up to $25,000/yr can offset ordinary (W-2) income if you actively participate and your MAGI is under $100k (phasing out to $0 by $150k); unused losses carry forward. On sale, claimed depreciation is recaptured at up to 25%, and gains may owe capital-gains tax (a 1031 exchange can defer both). Figures are a year-1 estimate at your 24.0% rate — not tax advice; consult a CPA.
Schools (NCES district)
- District
- Spartanburg 07
- NCES district ID
- 4503660
- Math proficiency
- 34% ▼ -1.00%
- Reading proficiency
- 41% ▼ -1.00%
- Median HH income
- $35,825
- Composite
- 31.04/100
- National rank
- #6087
- State rank
- #39 of 80 in SC
Livability — Whitney
No livability data for this city. (Only ~50 U.S. cities are tracked.)
Census & demographics
- Census place
- Whitney, SC
- County
- Spartanburg County · 258,607 people
- Metro
- Spartanburg, SC
- Population (ZIP)
- 28,381
- Household income
- $48,295
- Rent vs Own
- Severe rent burden
- 1218.0
Population outlook (Spartanburg County) Hauer SSP2
- Today (2025)
- 325,495 people
- By 2030
- 338,800 · +4.1%
- By 2040
- 363,471 · +11.7%
- By 2050
- 384,156 · +18.0%
- By 2075
- 430,137 · +32.1%
- By 2100
- 442,733 · +36.0%
Race, ethnicity, and origin ACS 2023
- Neighborhood character
- Diverse neighborhood (Simpson 0.67)
- Race & ethnicity
- White 42% Black 36% Hispanic / Latino 16% Two or more races 11% Asian 2%
- Hispanic origin (detail)
- Mexican 10% Puerto Rican 2%
- Common ancestry
- Slovak 2% Italian 1% Subsaharan African 1%
- Foreign-born
- 11% · Canada
- Languages at home
- 81% English-only · Spanish 15% Russian/Polish/Slavic 2% Other Asian/Pacific 1%
Political lean MEDSL · Spartanburg
- 2024 margin
- Solid R (+33.6) · D 32.6% · R 66.2% · Other 1.2%
- 2008→2024 swing
- -12.0pp toward R · 2008: -21.6pp · 2024: -33.6pp
- All cycles
- 2024: R+33.6 2020: R+27.3 2016: R+30.0 2012: R+23.1 2008: R+21.6
Not yet ingested
- Civics
- —
Market trends
- HPI YoY
- ▼ -45.19%
- Current HPI
- 274.443
- Rent YoY
- ▲ 3.69%
- Metro
- Spartanburg, SC
- State GDP YoY
- ▲ 4.51%
- F500 in state
- 2
Industry mix (Fortune 500 HQ in SC)
| Industry | F500 HQs | Revenue |
|---|---|---|
| Packaging | 1 | $7B |
|
||
Price history
-12.0% since first listed6 events — show timeline
- 2026-04-03 Price Changed $139,900 SPMLS
- 2026-03-11 Price Changed $144,900 SPMLS
- 2026-03-06 Price Changed $159,900 SPMLS
- 2025-11-26 Price Changed $149,900 SPMLS
- 2025-11-15 Price Changed $154,900 SPMLS
- 2025-10-07 Listed $159,000 SPMLS
Property tax history
+5.3%/yrLatest (2025): $1,297 · +5.3% YoY. Source: county tax records.
Cash-flow waterfall
monthlySold comps — $/sqft
last 12 mo · ≤1 miLoading sold comps…