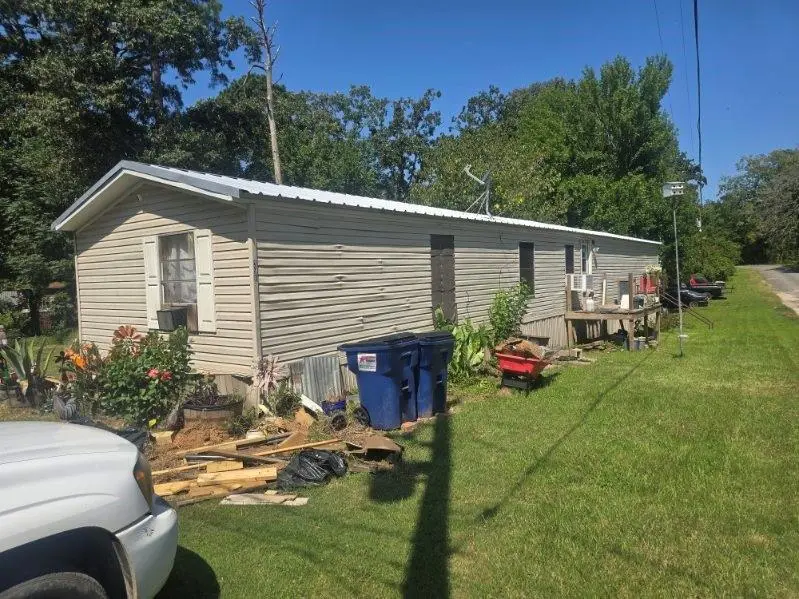
390 Campground Rd
Westwood Shores, TX 75862
$99,950B-
3 bd · 2.0 ba ·
1,036 sqft ·
Built 2005
· Manufactured
· Active
· 57 DOM
Cashflow @ list (25.0% down · 7.5%)
Estimated rent
$1,221/mo
Mortgage (P&I)
−$524
Tax + insurance
−$127
HOA
−$0
Vac / Maint / Mgmt
−$256
Net cashflow
$314/mo
Annual
$3,766/yr
Cap rate
10.06%
Cash-on-cash
13.46%
DSCR
1.60
1% rule
1.22%
Cash to close
$27,986
Investor read
- This is a 3-bed/2.0-bath manufactured listed at $100k.
- At list price, monthly cash flow is $314 ($4k/yr) — positive.
- The deal already cash-flows at list — no discount required.
- Meets the 1% rule at list price ($1k rent vs $100k).
- It's been on market 57 days — a 3% lower offer ($97k) is reasonable based on typical stale-listing flexibility.
- Recommended offer: $97k (3.0% below list) — sets the bar for market timing.
- In year one you build about $175 of equity ($692 loan paydown + $-517 appreciation (-0.5% local appreciation)).
- Location reads 62/100 on livability (#914 in TX) — a middle-class / working-renter tenant base. Strengths: crime A+, cost of living A+, housing A+; Watch: amenities F, commute F, health & safety F.
- Trinity ISD (rural): math 27% / reading 29% proficiency, ranked #682 of 826 in TX (top 83%) — low school quality limits family demand, transient renter base, plan for 1-2y turnover.
- Zoned schools: Lansberry El (math 35% / reading 33%, grade F, #2,149 of 4,322 statewide, top 50%, 570 students, 91% FRL) — zoned schools average 91% FRL vs 50% district-wide (40 pts higher); higher-poverty schools than district average — tighter screening recommended.
- Market conditions: 468 active listings in the ZIP; 1 units permitted in Trinity County in 2024 (0 in 5+ unit buildings).
- Trinity County population projected at -13% by 2050 — secular population decline; favor cash flow + early exit over multi-decade hold.
- At projected returns (-0.5% appreciation + 3.0% rent growth), your $28k cash investment doubles in ~6 years — after that, you're playing with house money.
- Climate carrying-cost: severe wind risk, 99% chance of damaging wind over 30y; extreme-heat days projected 7→24/yr by 2055 (HVAC capex compounding) — expect insurance premiums to compound above CPI over the hold.
- Cap rate 10.1% vs local median 3.6% in Westwood Shores — top-decile yield for the area; either an underpriced asset or a hidden risk that comps aren't pricing in. Stress-test before assuming the spread holds.
Questions for listing agent
- It's been on market 57 days. Have you received any prior offers? Is the seller open to a 3% concession, seller financing, or rate buy-down credit?
- Is there a deadline driving the sale (1031 exchange, divorce, estate, relocation)? That informs how much negotiation room exists.
- Schools are F-rated, which usually means shorter tenancies and higher turnover. Who's the typical renter profile here, and what's been the actual vacancy rate?
- What's the average days-on-market for RENTAL listings here right now (not sales)? A rising rental-DOM trend means longer vacancies and softer asking-rent achievability than the comps imply.
- What's the recent tenant-quality profile in this submarket — average credit score on applications, eviction rate, late-payment / NSF rate, and stable-employment percentage? A property-management company in the area should have these aggregated.
- How much new for-sale + rental construction is in the pipeline within 1–3 miles? Heavy new supply typically softens prices + rents 12–24 months out; constrained supply supports both.
CashFlowRE · CFR-QZ0RF1AFD8TDKF
· Data 23 h ago
cashflowre.app · 2026-05-29