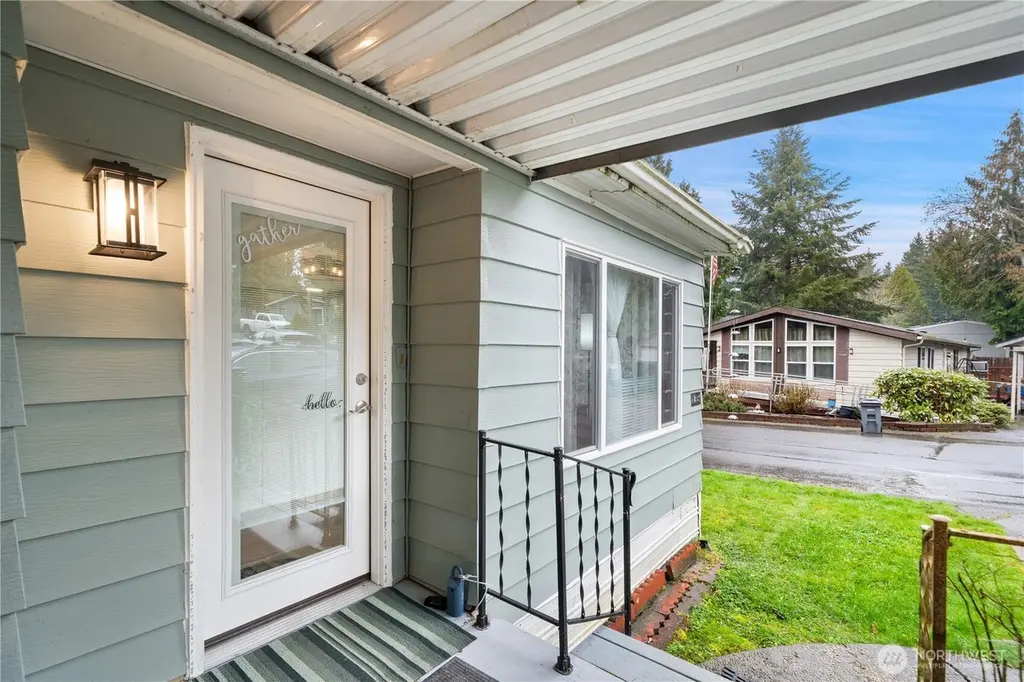
3060 NE McWilliams Rd #135
Tracyton, WA 98311
$99,000B+
2 bd · 2.0 ba ·
1,248 sqft ·
Built 1979
· Manufactured
· Pending
· 40 DOM
Cashflow @ list (25.0% down · 7.5%)
Estimated rent
$2,198/mo
Mortgage (P&I)
−$519
Tax + insurance
−$165
HOA
−$0
Vac / Maint / Mgmt
−$462
Net cashflow
$1,052/mo
Annual
$12,628/yr
Cap rate
19.05%
Cash-on-cash
45.56%
DSCR
3.03
1% rule
2.22%
Cash to close
$27,720
Investor read
- This is a 2-bed/2.0-bath manufactured listed at $99k.
- At list price, monthly cash flow is $1k ($13k/yr) — positive.
- The deal already cash-flows at list — no discount required.
- Meets the 1% rule at list price ($2k rent vs $99k).
- It's been on market 40 days — a 3% lower offer ($96k) is reasonable based on typical stale-listing flexibility.
- Recommended offer: $96k (3.0% below list) — sets the bar for market timing.
- Local home prices are declining (-3.0%/yr); year-one equity from $684 of loan paydown is wiped out by about $3k of value loss. Plan a longer hold.
- Location reads 73/100 on livability (#193 in WA) — a middle-class / working-renter tenant base. Strengths: employment A+, housing A+, health & safety A+; Watch: schools D+, cost of living D+, amenities F.
- Central Kitsap School District (urban): math 55% / reading 67% proficiency, ranked #49 of 291 in WA (top 17%) — acceptable for families but not a draw, mixed tenant base, ~2y average lease.
- Market conditions: Rents flat; 151 active listings in the ZIP; 11 comparable units currently listed for rent nearby; rentals at typical pace (median 14d on market — plan ~3-4 weeks tenant-placement turnaround); 45% of comp listings sitting > 30 days — soft ceiling on asking rent; solid renter incomes; 1,294 units permitted in Kitsap County in 2024 (302 in 5+ unit buildings).
- Kitsap County population projected at +8% by 2050 — modest demand growth; plan on rents tracking national, not racing it.
- 3 sale attempts since 18y ago; this cycle's ask has dropped $15k (13%) from the opening price — seller is motivated, your offer sets the floor, not the list.
- Current owner paid $72k; 37% above their basis — modest negotiation headroom, anchor on the comps not their cost.
- At projected returns (-3.0% appreciation + 0.3% rent growth), your $28k cash investment doubles in ~3 years — after that, you're playing with house money.
- Cap rate 19.0% vs local median 3.7% in Tracyton — top-decile yield for the area; either an underpriced asset or a hidden risk that comps aren't pricing in. Stress-test before assuming the spread holds.
Questions for listing agent
- It's been on market 40 days. Have you received any prior offers? Is the seller open to a 3% concession, seller financing, or rate buy-down credit?
- Built in 1979 — when were the roof, HVAC, electrical panel, plumbing, and water heater last replaced?
- Is there a deadline driving the sale (1031 exchange, divorce, estate, relocation)? That informs how much negotiation room exists.
- Schools are D-rated, which usually means shorter tenancies and higher turnover. Who's the typical renter profile here, and what's been the actual vacancy rate?
- What's the average days-on-market for RENTAL listings here right now (not sales)? A rising rental-DOM trend means longer vacancies and softer asking-rent achievability than the comps imply.
- What's the recent tenant-quality profile in this submarket — average credit score on applications, eviction rate, late-payment / NSF rate, and stable-employment percentage? A property-management company in the area should have these aggregated.
- How much new for-sale + rental construction is in the pipeline within 1–3 miles? Heavy new supply typically softens prices + rents 12–24 months out; constrained supply supports both.
CashFlowRE · CFR-QZ28VBEMJYWT7G
· Data 3 weeks ago
cashflowre.app · 2026-05-29