3060 NE McWilliams Rd #135 · Tracyton, WA
Flood risk 1/10 · Minimal
- FEMA flood zone
- X (unshaded)
- Chance of flooding over 30 yrs
- 0.0%
- Est. flood insurance / yr
- $507 – $1,088
Fire risk 3/10 · Minor
- Est. fire insurance / yr
- $604 – $1,122
Heat risk 3/10 · Minor
- Hot days now (above 86°F)
- 7 days/yr
- Hot days in 30 yrs
- 14 days/yr
Wind risk 1/10 · Minimal
- Chance of severe wind over 30 yrs
- —
Air-quality risk 7/10 · Major
- Unhealthy air days now
- 9 days/yr
- Unhealthy air days in 30 yrs
- 10 days/yr
Risk factors via First Street. Map © Google.
Why this score? — see what drove the B+ grade
The composite is a weighted blend of 9 inputs, each scored 0–100. Each bar is that input's sub-score; the figure is the points it added to the 100-point composite (weight × sub-score).
- Cash flow +30.0/30.0
- ARV discount +15.0/15.0
- 1% rule +10.0/10.0
- DSCR +10.0/10.0
- Schools +5.5/10.0
- Livability +3.7/5.0
- Rent growth +2.6/5.0
- Condition / age +2.5/5.0
- Appreciation +0.0/10.0
$99,000
🖨 Deal sheet 📄 Offer letter ✓ Due diligence
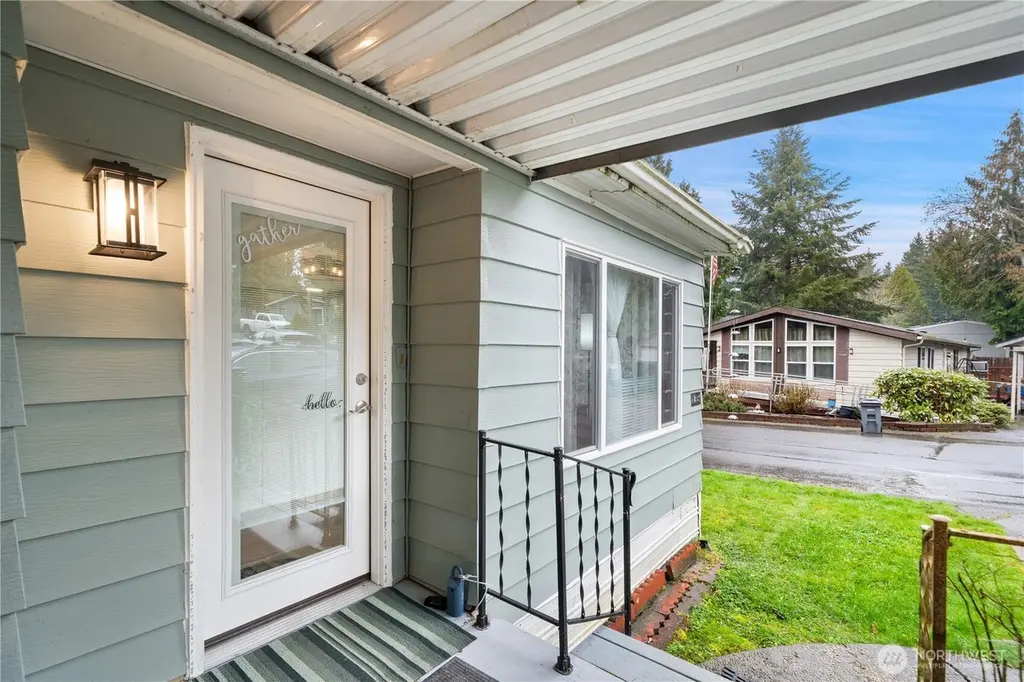
Listing remarks
New Price! $99,000. Why rent when you can own? Water and sewer are included in the space rent. This is one of the most affordable opportunities on the market. Located in an all-ages, owner-occupied community close to shopping, dining, and daily conveniences, this 2-bedroom, 1.75-bath home offers an open-concept layout that lives larger than expected, with lots of natural light. Recent improvements include a new roof (2021), a BRAND NEW furnace, all new upgraded windows, and updated fixtures. The kitchen features a newer fridge and dishwasher. Enjoy a covered porch, easy-care yard, and ample parking. Community amenities include a clubhouse, playground, and on-site laundry.
Key facts
- 4 parking spots
- Built 1979
- Listed 40 days
Neighborhood map
What this means for you Summary
Snapshot
- This is a 2-bed/2.0-bath manufactured listed at $99k.
Deal economics
- At list price, monthly cash flow is $1k ($13k/yr) — positive.
- The deal already cash-flows at list — no discount required.
- Meets the 1% rule at list price ($2k rent vs $99k).
- Recommended offer: $96k (3.0% below list) — sets the bar for market timing.
- Cap rate 19.0% vs local median 3.7% in Tracyton — top-decile yield for the area; either an underpriced asset or a hidden risk that comps aren't pricing in. Stress-test before assuming the spread holds.
Location & tenants
- Location reads 73/100 on livability (#193 in WA) — a middle-class / working-renter tenant base. Strengths: employment A+, housing A+, health & safety A+; Watch: schools D+, cost of living D+, amenities F.
- Central Kitsap School District (urban): math 55% / reading 67% proficiency, ranked #49 of 291 in WA (top 17%) — acceptable for families but not a draw, mixed tenant base, ~2y average lease.
- Market conditions: Rents flat; 151 active listings in the ZIP; 11 comparable units currently listed for rent nearby; rentals leasing fast (median 14d on market — plan ~1-2 weeks tenant-placement turnaround); 45% of comp listings sitting > 30 days — soft ceiling on asking rent; solid renter incomes; 1,294 units permitted in Kitsap County in 2024 (302 in 5+ unit buildings).
Forward outlook
- Local home prices are declining (-3.0%/yr); year-one equity from $684 of loan paydown is wiped out by about $3k of value loss. Plan a longer hold.
- Kitsap County population projected at +8% by 2050 — modest demand growth; plan on rents tracking national, not racing it.
- At projected returns (-3.0% appreciation + 0.3% rent growth), your $28k cash investment doubles in ~3 years — after that, you're playing with house money.
Negotiation context
- It's been on market 40 days — a 3% lower offer ($96k) is reasonable based on typical stale-listing flexibility.
- 3 sale attempts since 18y ago; this cycle's ask has dropped $15k (13%) from the opening price — seller is motivated, your offer sets the floor, not the list.
- Current owner paid $72k; 37% above their basis — modest negotiation headroom, anchor on the comps not their cost.
Questions for the listing agent
- It's been on market 40 days. Have you received any prior offers? Is the seller open to a 3% concession, seller financing, or rate buy-down credit?
- Built in 1979 — when were the roof, HVAC, electrical panel, plumbing, and water heater last replaced?
- Is there a deadline driving the sale (1031 exchange, divorce, estate, relocation)? That informs how much negotiation room exists.
- Schools are D-rated, which usually means shorter tenancies and higher turnover. Who's the typical renter profile here, and what's been the actual vacancy rate?
- What's the average days-on-market for RENTAL listings here right now (not sales)? A rising rental-DOM trend means longer vacancies and softer asking-rent achievability than the comps imply.
- What's the recent tenant-quality profile in this submarket — average credit score on applications, eviction rate, late-payment / NSF rate, and stable-employment percentage? A property-management company in the area should have these aggregated.
- How much new for-sale + rental construction is in the pipeline within 1–3 miles? Heavy new supply typically softens prices + rents 12–24 months out; constrained supply supports both.
Investment metrics
- 1% rule
- 2.22% ✓
- Cap rate
- 19.05%
- Cash-on-cash
- 45.56%
- DSCR
- 3.03
- GRM
- 3.8
CMA / ARV
- ARV (median comp)
- $150,109
- List price
- $99,000
- Delta
- -34.05%
- Verdict
- UNDERPRICED
- Comps
- 10 within 1.0 mi
Show comp detail 11 sales within ~0.75 mi
| Address | Dist | Beds/Ba | Sqft | Sold | Price | $/sf | Match |
|---|---|---|---|---|---|---|---|
| 3060 NE McWilliams Rd #79 | 0.06mi | 2/2.0 | 1,248 (0%) | 9mo | $80,000 | $64 | 90 |
| 3060 NE McWilliams Rd #2 | 0.00mi | 2/2.0 | 1,200 (-4%) | 8mo | $102,000 | $85 | 87 |
| 3060 NE McWilliams Rd #94 | 0.00mi | 3/2.0 (+1) | 1,232 (-1%) | 18mo | $140,000 | $114 | 78 |
| 3060 NE McWilliams Rd #61 | 0.06mi | 3/2.0 (+1) | 1,152 (-8%) | 3mo | $110,000 | $95 | 77 |
| 3060 NE McWilliams Rd #54 | 0.06mi | 3/2.0 (+1) | 1,200 (-4%) | 11mo | $140,000 | $117 | 77 |
| 3060 NE McWilliams Rd #124 | 0.07mi | 3/2.0 (+1) | 1,321 (+6%) | 8mo | $159,000 | $120 | 75 |
| 3060 NE McWilliams Rd #104 | 0.06mi | 3/2.0 (+1) | 1,344 (+8%) | 6mo | $165,000 | $123 | 74 |
| 3060 NE McWilliams Rd #60 | 0.06mi | 3/2.0 (+1) | 1,344 (+8%) | 13mo | $165,000 | $123 | 69 |
| 3060 NE McWilliams Rd #65 | 0.06mi | 2/2.0 | 1,152 (-8%) | 23mo | $153,000 | $133 | 65 |
| 3380 NE 3rd St N #29 | 0.28mi | 3/2.0 (+1) | 1,080 (-14%) | 4mo | $165,000 | $153 | 56 |
| 6450 Haneberg Ln NE | 0.30mi | 3/2.0 (+1) | 1,344 (+8%) | 22mo | $393,000 | $292 | 50 |
Match score weights: distance 35% · size 25% · config 20% · recency 20%. Top-matched comps best support the ARV.
Projected returns pro-forma
-3.0% appreciation · 0.27% rent growth · sell at horizon
- IRR
- 39.6%
- Equity multiple
- 2.63×
- Total profit
- $45,137
- Equity at exit
- $14,761
- IRR
- 44.6%
- Equity multiple
- 4.71×
- Total profit
- $102,907
- Equity at exit
- $8,560
Cash invested: $27,720 (down + closing). Projections, not guarantees.
Landlord ↔ Tenant lean methodology
- Overall (STATE)
- 28 Tenant-Leaning
- State Washington
- 28 Tenant-Leaning · D+8
- County
- — inherits STATE
- City
- — inherits STATE
ZIP-level market 98311
- Rents YoY
- 0.3%
- Active inventory
- 151
- Price-to-rent
- 3.8×
Monthly cashflow live
- Estimated rent
- $2,198 high interval (Pro) →
- Mortgage (P&I)
- −$519
- Tax est. 1.5%
- −$124 /mo · $1,485/yr
- Insurance
- −$41
- HOA
- −$0
- Vacancy / Maint / Mgmt
- −$462
- Net cashflow
- $1,052
Break-even live
UW: 25.0% down · 7.5% · 30yr · 1.5% tax · 5.0% vac · 8.0% maint · 8.0% mgmt
Financing live
Cash to close
- Down payment
- $24,750
- Closing costs
- $2,970
- Reserves months
- —
- Total cash needed
- —
Loan-product check · same deal, 3 products live
Conventional
25% down · 7.5% · 30yr
- Down + closing
- —
- Monthly P&I
- —
- Monthly cashflow
- —
- DSCR
- —
- Eligible?
- —
Personal DTI + credit; lowest rate.
DSCR
20% down · 8.5% · 30yr
- Down + closing
- —
- Monthly P&I
- —
- Monthly cashflow
- —
- DSCR
- —
- Eligible?
- —
No personal income docs; deal must DSCR.
Hard money
10% down · 12.0% · 12mo
- Down + closing
- —
- Monthly P&I
- —
- Monthly cashflow
- —
- DSCR
- —
- Eligible?
- —
Short-term bridge; refi at stabilization.
Rent comps 11 comps
| Address | Beds | Baths | Sqft | Rent | $/sqft | DOM | Units | Dist |
|---|---|---|---|---|---|---|---|---|
| 5848 Olive Ave NE Bremerton, WA | 3.0 | 2.0 | 1421 | $2,700 | $1.90 | 43d | 1 | 0.52mi |
| 6056 Illahee Rd NE Unit A Bremerton, WA | 2.0 | 1.0 | 711 | $1,850 | $2.60 | 43d | 1 | 0.67mi |
| 1970 NE Fuson Rd Bremerton, WA | 1.0–2.0 | 1.0–2.0 | 676 | $2,297 | $3.40 | 13d | 12 | 0.91mi |
| 6101 Washington 303 Bremerton, WA | 1.0–3.0 | 1.0–2.0 | 1010 | $2,378 | $2.35 | 13d | 70 | 1.06mi |
| 1231 NE McWilliams Rd Bremerton, WA | 1.0–3.0 | 1.0–2.0 | 961 | $2,227 | $2.32 | 13d | 26 | 1.10mi |
| 1381 NE Fairgrounds Rd Bremerton, WA | 1.0–3.0 | 1.0–2.0 | 949 | $2,022 | $2.13 | 13d | 14 | 1.23mi |
| 1303 NE Jasmine Ln Bremerton, WA | 2.0 | 1.5 | 1152 | $2,600 | $2.26 | 43d | 1 | 1.25mi |
| 1911 NE Riddell Rd Bremerton, WA | 2.0 | 1.0–2.0 | 858 | $1,980 | $2.31 | 13d | 10 | 1.33mi |
| 5180 Gibson Ln NE Unit B204 Bremerton, WA | 1.0 | 1.0 | 708 | $1,745 | $2.46 | 43d | 1 | 1.35mi |
| 5163 NE Mariah Ln Bremerton, WA | 1.0–2.0 | 1.0 | 821 | $1,895 | $2.31 | 13d | 2 | 1.40mi |
| 1823 NE Rustic Ln Bremerton, WA | 1.0 | 1.0 | 814 | $1,850 | $2.27 | 43d | 1 | 1.46mi |
Listing history 10 events
-
2026-05-05status Pending
-
2026-04-25price $99,000
-
2026-04-10price $109,000
-
2026-03-26$114,000 Active
-
2022-04-21soldstatus $72,500 Closed
-
2022-03-24status Pending
-
2022-03-09$72,500 Active
-
2009-03-23soldstatus $28,000 Sold
-
2009-02-18historical
-
2008-11-15$34,000
ⓘ Source: listings_history table (triggers on properties + properties_extension) + one-shot
backfill from property_details.listing_events for pre-trigger history.
Climate risk First Street
- Flood 1/10 Low FEMA zone X (unshaded) · 0% chance over 30 yrs
- Wildfire 3/10 Moderate
- Heat 3/10 Moderate 7 d/yr ≥86°F today · 14 d/yr by 30 yrs out
- Wind 1/10 Low
- Air quality 7/10 Severe 9 unhealthy d/yr today · 10 by 30 yrs out
Nearby sold comps map
Loading sold comps map…
Walkable amenities ~0.75 mi
Loading nearby amenities…
Taxation est. · year 1
- Rental income
- $26,377
- − Mortgage interest
- −$5,546
- − Property taxes
- −$1,485
- − Insurance
- −$495
- − Repairs & maintenance
- −$2,110
- − Management
- −$2,110
- − Depreciation
- −$2,880
- Taxable income
- $11,751
- Est. tax owed @ 24.0%
- −$2,820
- After-tax cash flow
- $9,808/yr
For passive investors: Depreciation is non-cash, so a rental often shows a tax loss while cash-flowing — sheltering income. Rental losses are passive: they offset passive income freely, and up to $25,000/yr can offset ordinary (W-2) income if you actively participate and your MAGI is under $100k (phasing out to $0 by $150k); unused losses carry forward. On sale, claimed depreciation is recaptured at up to 25%, and gains may owe capital-gains tax (a 1031 exchange can defer both). Figures are a year-1 estimate at your 24.0% rate — not tax advice; consult a CPA.
Schools (NCES district)
- District
- Central Kitsap School District
- NCES district ID
- 5301080
- Math proficiency
- 55% ▲ 1.00%
- Reading proficiency
- 67% ▬ 0.00%
- Median HH income
- $64,825
- Composite
- 54.87/100
- National rank
- #2813
- State rank
- #49 of 291 in WA
Livability — Tracyton
- Score
- 73/100
- State rank
- #193
- US rank
- #5240
Category grades
Schools grade is shown separately in the Schools card above.
Census & demographics
- County
- Kitsap County · 243,099 people
- Metro
- Bremerton-Silverdale-Port Orchard, WA
- Population (ZIP)
- 28,168
- Household income
- $108,757
- Rent vs Own
- Severe rent burden
- 502.0
Population outlook (Kitsap County) Hauer SSP2
- Today (2025)
- 277,525 people
- By 2030
- 285,040 · +2.7%
- By 2040
- 294,957 · +6.3%
- By 2050
- 300,622 · +8.3%
- By 2075
- 315,580 · +13.7%
- By 2100
- 304,340 · +9.7%
Race, ethnicity, and origin ACS 2023
- Neighborhood character
- Predominantly White (67%)
- Race & ethnicity
- White 67% Two or more races 14% Hispanic / Latino 9% Asian 9% Black 3% Pacific Islander 2%
- Hispanic origin (detail)
- Mexican 6%
- Common ancestry
- Portuguese 4% Italian 4% Slovak 3%
- Foreign-born
- 9% · Canada, Vietnam, China
- Languages at home
- 89% English-only · Tagalog/Filipino 4% Spanish 3% Vietnamese 2%
Political lean MEDSL · Kitsap
- 2024 margin
- Strong D (+20.9) · D 58.8% · R 37.9% · Other 3.3%
- 2008→2024 swing
- +8.6pp toward D · 2008: 12.3pp · 2024: 20.9pp
- All cycles
- 2024: D+20.9 2020: D+18.1 2016: D+11.6 2012: D+11.1 2008: D+12.3
Not yet ingested
- Civics
- —
Market trends
- HPI YoY
- ▼ -378.18%
- Current HPI
- 356.6272
- Rent YoY
- ▲ 0.27%
- Metro
- Bremerton-Silverdale-Port Orchard, WA
- State GDP YoY
- ▲ 4.65%
- F500 in state
- 22
Industry mix (Fortune 500 HQ in WA)
| Industry | F500 HQs | Revenue |
|---|---|---|
| Retail | 2 | $269B |
|
||
| Technology / Retail | 1 | $638B |
|
||
| Technology | 1 | $245B |
|
||
| Telecommunications | 1 | $38B |
|
||
| Food / Beverage | 1 | $36B |
|
||
| Automotive / Trucks | 1 | $34B |
|
||
Price history
+191.2% since first listed10 events — show timeline
- 2026-05-05 Pending — NWMLS as Distributed by MLS Grid
- 2026-04-25 Price Changed $99,000 NWMLS as Distributed by MLS Grid
- 2026-04-10 Price Changed $109,000 NWMLS as Distributed by MLS Grid
- 2026-03-26 Listed $114,000 NWMLS as Distributed by MLS Grid
- 2022-04-21 Sold (MLS) $72,500 NWMLS as Distributed by MLS Grid
- 2022-03-24 Pending — NWMLS as Distributed by MLS Grid
- 2022-03-09 Listed $72,500 NWMLS as Distributed by MLS Grid
- 2009-03-23 Sold (MLS) $28,000 NWMLS as Distributed by MLS Grid
- 2009-02-18 Delisted — NWMLS as Distributed by MLS Grid
- 2008-11-15 Listed $34,000 NWMLS as Distributed by MLS Grid
Cash-flow waterfall
monthlySold comps — $/sqft
last 12 mo · ≤1 miLoading sold comps…