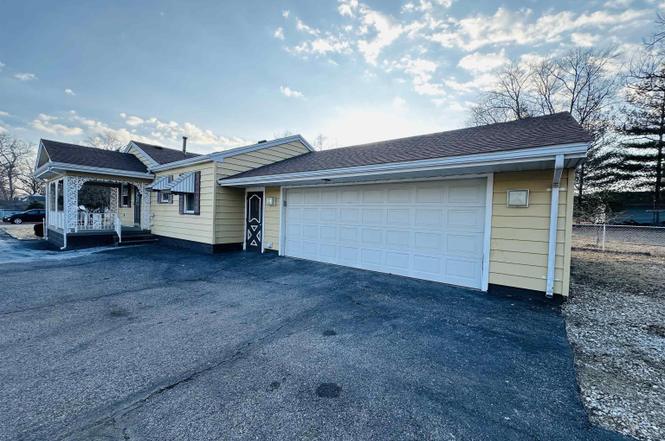
3135 W Starr St
Peoria, IL 61605
$97,000C
3 bd · 1.0 ba ·
960 sqft ·
Built 1951
· SingleFamily
· Pending
· 64 DOM
Cashflow @ list (25.0% down · 7.5%)
Estimated rent
$1,039/mo
Mortgage (P&I)
−$509
Tax + insurance
−$184
HOA
−$0
Vac / Maint / Mgmt
−$218
Net cashflow
$129/mo
Annual
$1,545/yr
Cap rate
7.89%
Cash-on-cash
5.69%
DSCR
1.25
1% rule
1.07%
Cash to close
$27,160
Investor read
- This is a 3-bed/1.0-bath single-family listed at $97k.
- At list price, monthly cash flow is $129 ($2k/yr) — positive.
- The deal already cash-flows at list — no discount required.
- Meets the 1% rule at list price ($1k rent vs $97k).
- It's been on market 64 days — a 6% lower offer ($91k) is reasonable based on typical stale-listing flexibility.
- Recommended offer: $91k (6.0% below list) — sets the bar for market timing.
- In year one you build about $1k of equity ($671 loan paydown + $614 appreciation (0.6% local appreciation)).
- Location reads 73/100 on livability (#270 in IL) — a middle-class / working-renter tenant base. Strengths: commute A+, cost of living A+, housing A+; Watch: employment D+, crime F.
- Limestone Chsd 310 (rural): math 25% / reading 35% proficiency, ranked #486 of 919 in IL (top 53%) — families likely to look elsewhere, expect single-tenant / working-renter base with shorter leases.
- Zoned schools: Limestone Community High School (math 17% / reading 22%, grade F, #397 of 693 statewide, top 61%, 924 students, 0% FRL).
- Watch-outs: built in 1951 — expect roof / HVAC / electrical / plumbing capex.
- Market conditions: 42 active listings in the ZIP; 15 comparable units currently listed for rent nearby; rentals at typical pace (median 14d on market — plan ~3-4 weeks tenant-placement turnaround); lower-income renter base — watch delinquency; 73 units permitted in Peoria County in 2024 (0 in 5+ unit buildings).
- Peoria County population projected at -11% by 2050 — secular population decline; favor cash flow + early exit over multi-decade hold.
- At projected returns (0.6% appreciation + 3.0% rent growth), your $27k cash investment doubles in ~8 years — after that, you're playing with house money.
- Cap rate 7.9% vs local median 5.6% in Peoria — top-decile yield for the area; either an underpriced asset or a hidden risk that comps aren't pricing in. Stress-test before assuming the spread holds.
- At $1,039/mo this rent would consume 47% of the median local household income ($26k/yr) (locally 1385% of renters already pay >50% of income on rent) — very limited rent-growth headroom before tenants either downsize or default.
Questions for listing agent
- It's been on market 64 days. Have you received any prior offers? Is the seller open to a 6% concession, seller financing, or rate buy-down credit?
- Built in 1951 — when were the roof, HVAC, electrical panel, plumbing, and water heater last replaced?
- Why hasn't it sold? Are there any deal-killer items the seller is aware of (foundation, flood, title, zoning, code violations)?
- Is there a deadline driving the sale (1031 exchange, divorce, estate, relocation)? That informs how much negotiation room exists.
- Schools are F-rated, which usually means shorter tenancies and higher turnover. Who's the typical renter profile here, and what's been the actual vacancy rate?
- Crime grade is F in this area — have there been break-ins, vandalism, or insurance claims at this property in the last 3 years? What carrier currently insures it and at what premium?
- What's the average days-on-market for RENTAL listings here right now (not sales)? A rising rental-DOM trend means longer vacancies and softer asking-rent achievability than the comps imply.
- What's the recent tenant-quality profile in this submarket — average credit score on applications, eviction rate, late-payment / NSF rate, and stable-employment percentage? A property-management company in the area should have these aggregated.
CashFlowRE · CFR-R0Y0523VQAF01Z
· Data 3 weeks ago
cashflowre.app · 2026-05-29