3135 W Starr St · Peoria, IL
Flood risk 1/10 · Minimal
- FEMA flood zone
- X
- Chance of flooding over 30 yrs
- 0.0%
- Est. flood insurance / yr
- $507 – $1,088
Fire risk 1/10 · Minimal
- Est. fire insurance / yr
- $804 – $1,492
Heat risk 3/10 · Minor
- Hot days now (above 105°F)
- 7 days/yr
- Hot days in 30 yrs
- 18 days/yr
Wind risk 2/10 · Minimal
- Chance of severe wind over 30 yrs
- 1.0%
Air-quality risk 3/10 · Minor
- Unhealthy air days now
- 1 days/yr
- Unhealthy air days in 30 yrs
- 3 days/yr
Risk factors via First Street. Map © Google.
Why this score? — see what drove the C grade
The composite is a weighted blend of 9 inputs, each scored 0–100. Each bar is that input's sub-score; the figure is the points it added to the 100-point composite (weight × sub-score).
- Cash flow +20.6/30.0
- ARV discount +7.5/15.0
- DSCR +6.5/10.0
- 1% rule +5.7/10.0
- Appreciation +5.3/10.0
- Livability +3.7/5.0
- Schools +2.9/10.0
- Rent growth +2.5/5.0
- Condition / age +2.5/5.0
$97,000
🖨 Deal sheet (PDF) 📄 Offer letter ✓ Due diligence
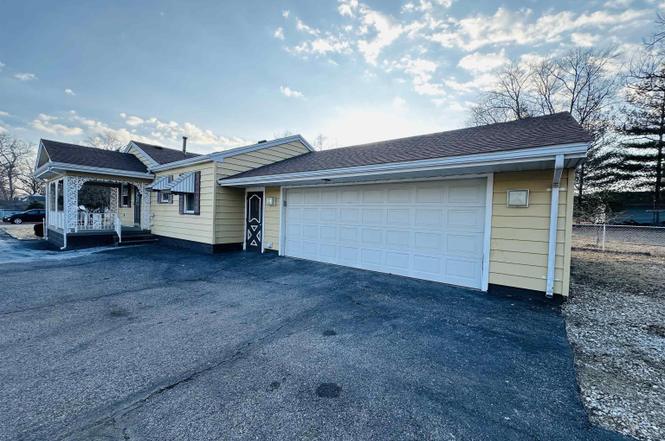
Listing remarks
Beautiful home in LIMESTONE school district- have a large driveway that can hold 10+ cars in addition of the attached 2 car garage. great updates, flooring, painted, bath and much more. Basement and Crawl space. It has 16X 8 porch. The basement (25.02 X 20 sqft ) needs concrete flooring. measurements are approximately and no guaranty
Key facts
- 7,735 sq ft lot
- 2 garage spots
- Built 1951
Property features AI
Exterior
- Parking: Attached 2-car garage
- Utilities: Public water; Public sewer
- Home design: Single-family residence; Built in 1951; Shingle roof
- Construction: Unfinished basement (foundation present)
- Exterior features: Level lot
Interior
- Kitchen: Kitchen on main level
- Bedrooms: 3 bedrooms (main level bedrooms listed; egress windows in bedrooms); Bedroom sizes on main level: approximately 11.04 x 10.02, 11 x 13.05, and 10 x 9.06 feet
- Flooring: Laminate flooring throughout main living areas and bedrooms
- Bathrooms: 1 full bathroom
- Heating & cooling: Forced air heating; Gas water heater; Central air conditioning
- Interior features: Unfinished basement; No fireplace
- Laundry & utility: Main level laundry room (approx. 6.04 x 5 feet)
Neighborhood map
What this means for you Summary
Snapshot
- This is a 3-bed/1.0-bath single-family listed at $97k.
Deal economics
- At list price, monthly cash flow is $129 ($2k/yr) — positive.
- The deal already cash-flows at list — no discount required.
- Meets the 1% rule at list price ($1k rent vs $97k).
- Recommended offer: $91k (6.0% below list) — sets the bar for market timing.
- Cap rate 7.9% vs local median 5.6% in Peoria — top-decile yield for the area; either an underpriced asset or a hidden risk that comps aren't pricing in. Stress-test before assuming the spread holds.
Location & tenants
- Location reads 73/100 on livability (#270 in IL) — a middle-class / working-renter tenant base. Strengths: commute A+, cost of living A+, housing A+; Watch: employment D+, crime F.
- Limestone Chsd 310 (rural): math 25% / reading 35% proficiency, ranked #486 of 919 in IL (top 53%) — families likely to look elsewhere, expect single-tenant / working-renter base with shorter leases.
- Zoned schools: Limestone Community High School (math 17% / reading 22%, grade F, #397 of 693 statewide, top 61%, 924 students, 0% FRL).
- Market conditions: 42 active listings in the ZIP; 15 comparable units currently listed for rent nearby; rentals at typical pace (median 14d on market — plan ~3-4 weeks tenant-placement turnaround); lower-income renter base — watch delinquency; 73 units permitted in Peoria County in 2024 (0 in 5+ unit buildings).
- At $1,039/mo this rent would consume 47% of the median local household income ($26k/yr) (locally 1385% of renters already pay >50% of income on rent) — very limited rent-growth headroom before tenants either downsize or default.
Forward outlook
- In year one you build about $1k of equity ($671 loan paydown + $614 appreciation (0.6% local appreciation)).
- Peoria County population projected at -11% by 2050 — secular population decline; favor cash flow + early exit over multi-decade hold.
- At projected returns (0.6% appreciation + 3.0% rent growth), your $27k cash investment doubles in ~8 years — after that, you're playing with house money.
Negotiation context
- It's been on market 64 days — a 6% lower offer ($91k) is reasonable based on typical stale-listing flexibility.
Risks & watch-outs
- Watch-outs: built in 1951 — expect roof / HVAC / electrical / plumbing capex.
Questions for the listing agent
- It's been on market 64 days. Have you received any prior offers? Is the seller open to a 6% concession, seller financing, or rate buy-down credit?
- Built in 1951 — when were the roof, HVAC, electrical panel, plumbing, and water heater last replaced?
- Why hasn't it sold? Are there any deal-killer items the seller is aware of (foundation, flood, title, zoning, code violations)?
- Is there a deadline driving the sale (1031 exchange, divorce, estate, relocation)? That informs how much negotiation room exists.
- Schools are F-rated, which usually means shorter tenancies and higher turnover. Who's the typical renter profile here, and what's been the actual vacancy rate?
- Crime grade is F in this area — have there been break-ins, vandalism, or insurance claims at this property in the last 3 years? What carrier currently insures it and at what premium?
- What's the average days-on-market for RENTAL listings here right now (not sales)? A rising rental-DOM trend means longer vacancies and softer asking-rent achievability than the comps imply.
- What's the recent tenant-quality profile in this submarket — average credit score on applications, eviction rate, late-payment / NSF rate, and stable-employment percentage? A property-management company in the area should have these aggregated.
- How much new for-sale + rental construction is in the pipeline within 1–3 miles? Heavy new supply typically softens prices + rents 12–24 months out; constrained supply supports both.
Investment metrics
- 1% rule
- 1.07% ✓
- Cap rate
- 7.89%
- Cash-on-cash
- 5.69%
- DSCR
- 1.25
- GRM
- 7.8
CMA / ARV
- ARV (on-the-fly)
- $33,600
- Comps found
- 12
Show comp detail 12 sales within ~0.75 mi
| Address | Dist | Beds/Ba | Sqft | Sold | Price | $/sf | Match |
|---|---|---|---|---|---|---|---|
| 3135 W Starr St | 0.00mi | 3/1.0 | 960 (0%) | 1mo | $100,000 | $104 | 99 |
| 3021 W Malone St | 0.17mi | 2/1.0 (-1) | 1,000 (+4%) | 1mo | $17,000 | $17 | 79 |
| 2722 W Marquette St | 0.43mi | 3/1.0 | 1,008 (+5%) | 6mo | $35,000 | $35 | 66 |
| 1023 S Tonti Cir | 0.21mi | 2/1.0 (-1) | 896 (-7%) | 10mo | $70,000 | $78 | 66 |
| 2506 W Humboldt St | 0.59mi | 3/1.0 | 908 (-5%) | 2mo | $10,000 | $11 | 62 |
| 2600 W Fremont St | 0.57mi | 2/1.0 (-1) | 968 (+1%) | 8mo | $39,000 | $40 | 60 |
| 2807 W Marquette St | 0.41mi | 3/1.0 | 1,048 (+9%) | 9mo | $25,000 | $24 | 58 |
| 907 S Manual Ave | 0.42mi | 3/2.0 | 1,084 (+13%) | 6mo | $103,900 | $96 | 50 |
| 2502 W Malone St | 0.59mi | 3/1.0 | 864 (-10%) | 10mo | $9,000 | $10 | 48 |
| 2701 W Hayes St | 0.51mi | 3/1.0 | 1,099 (+14%) | 7mo | $80,000 | $73 | 46 |
| 1404 S Arago St | 0.74mi | 3/— | 828 (-14%) | 2mo | $2,500 | $3 | 41 |
| 2320 W Garden St | 0.75mi | 2/1.0 (-1) | 1,096 (+14%) | 3mo | $20,000 | $18 | 34 |
Match score weights: distance 35% · size 25% · config 20% · recency 20%. Top-matched comps best support the ARV.
Projected returns pro-forma
0.63% appreciation · 3.0% rent growth · sell at horizon
- IRR
- 6.2%
- Equity multiple
- 1.31×
- Total profit
- $8,313
- Equity at exit
- $31,273
- IRR
- 10.7%
- Equity multiple
- 2.25×
- Total profit
- $34,034
- Equity at exit
- $40,172
Cash invested: $27,160 (down + closing). Projections, not guarantees.
Landlord ↔ Tenant lean methodology
- Overall (STATE)
- 43 Moderately Tenant-Leaning
- State Illinois
- 43 Moderately Tenant-Leaning · D+7
- County
- — inherits STATE
- City
- — inherits STATE
ZIP-level market 61605
- Home prices YoY
- 0.4%
- Active inventory
- 42
- Price-to-rent
- 7.8×
Monthly cashflow live
- Estimated rent
- $1,039 high interval (Pro) →
- Mortgage (P&I)
- −$509
- Tax from tax record
- −$143 /mo · $1,720/yr
- Insurance
- −$40
- HOA
- −$0
- Vacancy / Maint / Mgmt
- −$218
- Net cashflow
- $129
Break-even live
Sensitivity live
| Price | -10% $184 | -5% $156 | +0% $129 | +5% $101 | +10% $74 |
|---|---|---|---|---|---|
| Rent | -10% $47 | -5% $88 | +0% $129 | +5% $170 | +10% $211 |
| Rate | -1.0pp $178 | -0.5pp $153 | base $129 | +0.5pp $104 | +1.0pp $78 |
UW: 25.0% down · 7.5% · 30yr · 1.5% tax · 5.0% vac · 8.0% maint · 8.0% mgmt
Financing live
Cash to close
- Down payment
- $24,250
- Closing costs
- $2,910
- Reserves months
- —
- Total cash needed
- —
Loan-product check · same deal, 3 products live
Conventional
25% down · 7.5% · 30yr
- Down + closing
- —
- Monthly P&I
- —
- Monthly cashflow
- —
- DSCR
- —
- Eligible?
- —
Personal DTI + credit; lowest rate.
DSCR
20% down · 8.5% · 30yr
- Down + closing
- —
- Monthly P&I
- —
- Monthly cashflow
- —
- DSCR
- —
- Eligible?
- —
No personal income docs; deal must DSCR.
Hard money
10% down · 12.0% · 12mo
- Down + closing
- —
- Monthly P&I
- —
- Monthly cashflow
- —
- DSCR
- —
- Eligible?
- —
Short-term bridge; refi at stabilization.
Rent comps 15 comps
| Address | Beds | Baths | Sqft | Rent | $/sqft | DOM | Units | Dist |
|---|---|---|---|---|---|---|---|---|
| 906 S Tonti Cir Peoria, IL | 2.0 | 1.0 | 780 | $950 | $1.22 | 14d | 1 | 0.35mi |
| 2804 W Humboldt St Peoria, IL | 3.0 | 1.0 | 1060 | $995 | $0.94 | 14d | 1 | 0.38mi |
| 2822 W Antoinette St Peoria, IL | 2.0 | 1.0 | 720 | $1,149 | $1.60 | 21d | 1 | 0.40mi |
| 1825 S Kneer Ave Peoria, IL | 2.0 | 1.0 | 858 | $858 | $1.00 | 14d | 1 | 0.47mi |
| 3031 W Wiswall St Peoria, IL | 2.0 | 1.0 | 1100 | $1,100 | $1.00 | 14d | 1 | 0.48mi |
| 3001 W Wiswall St Peoria, IL | 2.0 | 1.0 | 1000 | $1,100 | $1.10 | 14d | 1 | 0.51mi |
| 2916 W Meidroth St Peoria, IL | 2.0 | 1.0 | 1125 | $1,049 | $0.93 | 21d | 1 | 0.67mi |
| 2320 W Garden St Peoria, IL | 2.0 | 1.0 | 1096 | $1,000 | $0.91 | 44d | 1 | 0.74mi |
| 1507 S Livingston St Peoria, IL | 2.0 | 1.0 | 842 | $946 | $1.12 | 44d | 1 | 0.84mi |
| 2116 W Proctor St Peoria, IL | 2.0 | 1.0 | 912 | $879 | $0.96 | 14d | 1 | 0.94mi |
| 1610 S Lydia Ave Peoria, IL | 4.0 | 1.0 | 850 | $850 | $1.00 | 14d | 1 | 0.96mi |
| 2317 W Martin Luther King Junior Dr Unit 2-214 Peoria, IL | 2.0 | 1.0 | 807 | $800 | $0.99 | 44d | 1 | 1.06mi |
| 2317 W Martin Luther King Junior Dr Peoria, IL | 1.0–2.0 | 1.0 | 697 | $800 | $1.15 | 14d | 3 | 1.06mi |
| 928 S Matthew St Peoria, IL | 2.0 | 1.0 | 1080 | $748 | $0.69 | 14d | 1 | 1.33mi |
| 945 S Shelley St Peoria, IL | 1.0–3.0 | 1.0–2.0 | 929 | $1,025 | $1.10 | 14d | 1 | 1.43mi |
Listing history 4 events
-
2026-04-19status Pending
-
2026-04-08price $97,000
-
2026-02-14$115,000 Active
-
2026-02-13historical $115,000
ⓘ Source: listings_history table (triggers on properties + properties_extension) + one-shot
backfill from property_details.listing_events for pre-trigger history.
Tax reassessment forecast IL · Partial reset (capped growth)
- Current annual tax
- $1,720 · $143/mo
- Projected year-2 tax
- $1,961 · $163/mo
- Expected delta
- +$241/yr (+$20/mo · 14.0%)
ⓘ Screening estimate from a state-policy table — verify with the county assessor before closing.
Climate risk First Street
- Flood 1/10 Low FEMA zone X · 0% chance over 30 yrs
- Wildfire 1/10 Low
- Heat 3/10 Moderate 7 d/yr ≥105°F today · 18 d/yr by 30 yrs out
- Wind 2/10 Low 100% chance of damaging wind over 30 yrs
- Air quality 3/10 Moderate 1 unhealthy d/yr today · 3 by 30 yrs out
Nearby sold comps map
Loading sold comps map…
Walkable amenities ~0.75 mi
Loading nearby amenities…
Taxation est. · year 1
- Rental income
- $12,474
- − Mortgage interest
- −$5,434
- − Property taxes
- −$1,720
- − Insurance
- −$485
- − Repairs & maintenance
- −$998
- − Management
- −$998
- − Depreciation
- −$2,822
- Taxable income
- $17
- Est. tax owed @ 24.0%
- −$4
- After-tax cash flow
- $1,541/yr
For passive investors: Depreciation is non-cash, so a rental often shows a tax loss while cash-flowing — sheltering income. Rental losses are passive: they offset passive income freely, and up to $25,000/yr can offset ordinary (W-2) income if you actively participate and your MAGI is under $100k (phasing out to $0 by $150k); unused losses carry forward. On sale, claimed depreciation is recaptured at up to 25%, and gains may owe capital-gains tax (a 1031 exchange can defer both). Figures are a year-1 estimate at your 24.0% rate — not tax advice; consult a CPA.
Schools (NCES district)
- District
- Limestone Chsd 310
- NCES district ID
- 1722950
- Math proficiency
- 25% ▲ 5.00%
- Reading proficiency
- 35% ▲ 4.00%
- Median HH income
- $49,759
- Composite
- 28.99/100
- National rank
- #11932
- State rank
- #486 of 919 in IL
Livability — Peoria
- Score
- 73/100
- State rank
- #270
- US rank
- #5096
Category grades
Schools grade is shown separately in the Schools card above.
Census & demographics
- County
- Peoria County · 120,495 people
- City population
- 114,670
- Metro
- Peoria, IL
- Population (ZIP)
- 13,424
- Household income
- $26,392
- Rent vs Own
- Severe rent burden
- 1385.0
Population outlook (Peoria County) Hauer SSP2
- Today (2025)
- 183,007 people
- By 2030
- 179,643 · -1.8%
- By 2040
- 171,782 · -6.1%
- By 2050
- 163,508 · -10.7%
- By 2075
- 140,178 · -23.4%
- By 2100
- 114,493 · -37.4%
Race, ethnicity, and origin ACS 2023
- Neighborhood character
- Diverse neighborhood (Simpson 0.61)
- Race & ethnicity
- Black 56% White 27% Hispanic / Latino 12% Two or more races 7% Native American 1%
- Hispanic origin (detail)
- Mexican 8%
- Common ancestry
- Lithuanian 1% Iranian 1% Portuguese 1%
- Foreign-born
- 4% · Canada, Vietnam
- Languages at home
- 92% English-only · Spanish 7%
Political lean MEDSL · Peoria
- 2024 margin
- Toss-up / Even · D 51.5% · R 46.9% · Other 1.6%
- 2008→2024 swing
- -9.2pp toward R · 2008: 13.9pp · 2024: 4.7pp
- All cycles
- 2024: D+4.7 2020: D+6.3 2016: D+2.8 2012: D+4.4 2008: D+13.9
Not yet ingested
- Civics
- —
Market trends
- HPI YoY
- ▲ 0.63%
- Current HPI
- 170.5814
- Rent YoY
- —
- Metro
- Peoria, IL
- State GDP YoY
- ▲ 1.59%
- F500 in state
- 60
Industry mix (Fortune 500 HQ in IL)
| Industry | F500 HQs | Revenue |
|---|---|---|
| Insurance | 4 | $201B |
|
||
| Consumer Goods | 4 | $87B |
|
||
| Industrial Machinery | 3 | $64B |
|
||
| Healthcare | 2 | $55B |
|
||
| Retail / Pharmacy | 1 | $148B |
|
||
| Agriculture / Food | 1 | $86B |
|
||
Price history
-15.7% since first listed4 events — show timeline
- 2026-04-19 Pending — RMLSA as Distributed by MLS Grid
- 2026-04-08 Price Changed $97,000 RMLSA as Distributed by MLS Grid
- 2026-02-14 Listed $115,000 RMLSA as Distributed by MLS Grid
- 2026-02-13 Coming Soon $115,000 RMLSA as Distributed by MLS Grid
Property tax history
+21.8%/yrLatest (2024): $1,720 · +5.2% YoY. Source: county tax records.
Cash-flow waterfall
monthlySold comps — $/sqft
last 12 mo · ≤1 miLoading sold comps…