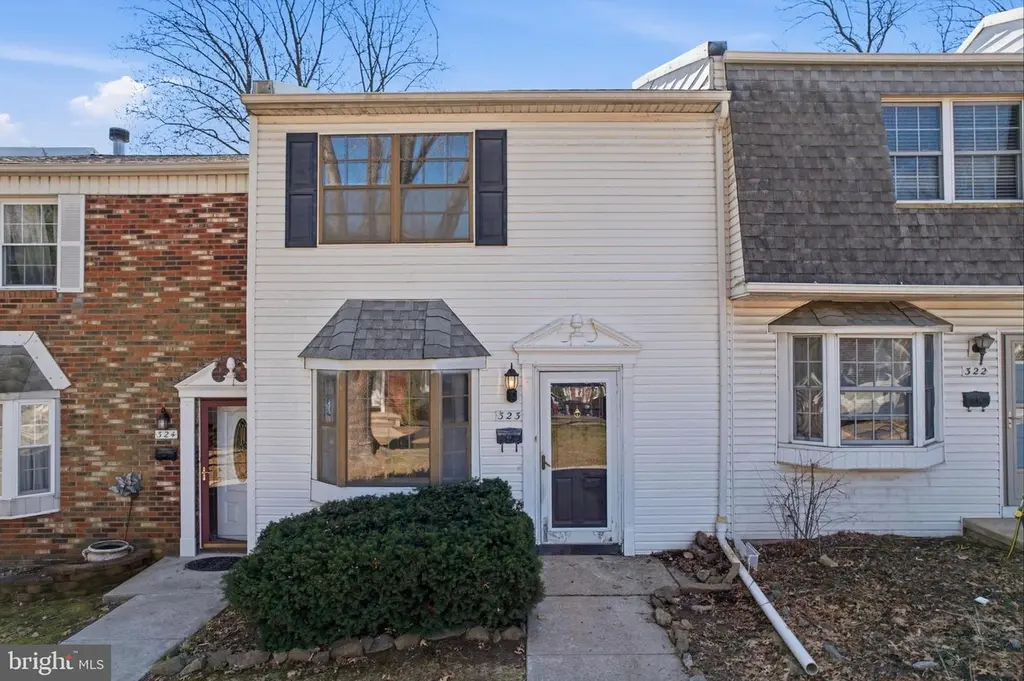
323 Harvard Sq
Croydon, PA 19020
$269,900D
3 bd · 1.5 ba ·
1,188 sqft ·
Built 1974
· Townhouse
· Pending
· 39 DOM
Cashflow @ list (25.0% down · 7.5%)
Estimated rent
$2,361/mo
Mortgage (P&I)
−$1,415
Tax + insurance
−$415
HOA
−$304
Vac / Maint / Mgmt
−$496
Net cashflow
$-269/mo
Annual
$-3,228/yr
Cap rate
5.10%
Cash-on-cash
-4.27%
DSCR
0.81
1% rule
0.87%
Cash to close
$75,572
Investor read
- This is a 3-bed/1.5-bath townhouse listed at $270k.
- At list price, monthly cash flow is $-269 ($-3k/yr) — negative.
- To cash-flow at today's rent, offer at most $222k (17.6% below list).
- To meet the 1% rule (rent ≥ 1% of price), the offer needs to be $236k (12.5% below list).
- It's been on market 39 days — a 3% lower offer ($262k) is reasonable based on typical stale-listing flexibility.
- Recommended offer: $222k (17.6% below list) — sets the bar for cash-flow.
- Local home prices are declining (-3.0%/yr); year-one equity from $2k of loan paydown is wiped out by about $8k of value loss. Plan a longer hold.
- Location reads 71/100 on livability (#695 in PA) — a middle-class / working-renter tenant base. Strengths: cost of living A+, housing A+, crime B+; Watch: schools D+, amenities F, health & safety F.
- Bensalem Township SD (suburban): math 21% / reading 34% proficiency, ranked #447 of 539 in PA (top 83%) — low school quality limits family demand, transient renter base, plan for 1-2y turnover.
- Market conditions: Rents rising fast (+6.1%/yr); 147 active listings in the ZIP; 9 comparable units currently listed for rent nearby; rentals at typical pace (median 19d on market — plan ~3-4 weeks tenant-placement turnaround); solid renter incomes; 663 units permitted in Bucks County in 2024 (106 in 5+ unit buildings).
- Bucks County population projected to shrink 7% by 2050 — rents likely to lag national; underwrite the cash flow, not the appreciation.
- Current owner paid $220k; 23% above their basis — modest negotiation headroom, anchor on the comps not their cost.
- Climate carrying-cost: major wind risk, 27% chance of damaging wind over 30y; extreme-heat days projected 7→15/yr by 2055 (HVAC capex compounding) — expect insurance premiums to compound above CPI over the hold.
- Cap rate 5.1% vs local median 4.2% in Croydon — meaningfully above typical; check what's discounted (condition, days-on-market, listing class) to confirm the premium yield is real.
- This rent runs 34% of the median local income ($83k/yr) — at the standard rent-burdened threshold; future hikes will face affordability resistance.
Questions for listing agent
- What do current leases actually rent for vs. the listed asking? Can we see a recent rent roll and the last 12 months of T-12 income?
- It's been on market 39 days. Have you received any prior offers? Is the seller open to a 18% concession, seller financing, or rate buy-down credit?
- Built in 1974 — when were the roof, HVAC, electrical panel, plumbing, and water heater last replaced?
- What does the HOA fee cover, when was the last increase, and are there any pending special assessments or reserve-fund shortfalls?
- Is there a deadline driving the sale (1031 exchange, divorce, estate, relocation)? That informs how much negotiation room exists.
- Schools are D-rated, which usually means shorter tenancies and higher turnover. Who's the typical renter profile here, and what's been the actual vacancy rate?
- The area grade is low — what's the realistic commute time and amenity access for the typical tenant pool here? Any planned neighborhood developments (good or bad) we should know about?
- What's the average days-on-market for RENTAL listings here right now (not sales)? A rising rental-DOM trend means longer vacancies and softer asking-rent achievability than the comps imply.
CashFlowRE · CFR-R1B0G0EN3J523T
· Data 3 weeks ago
cashflowre.app · 2026-05-29