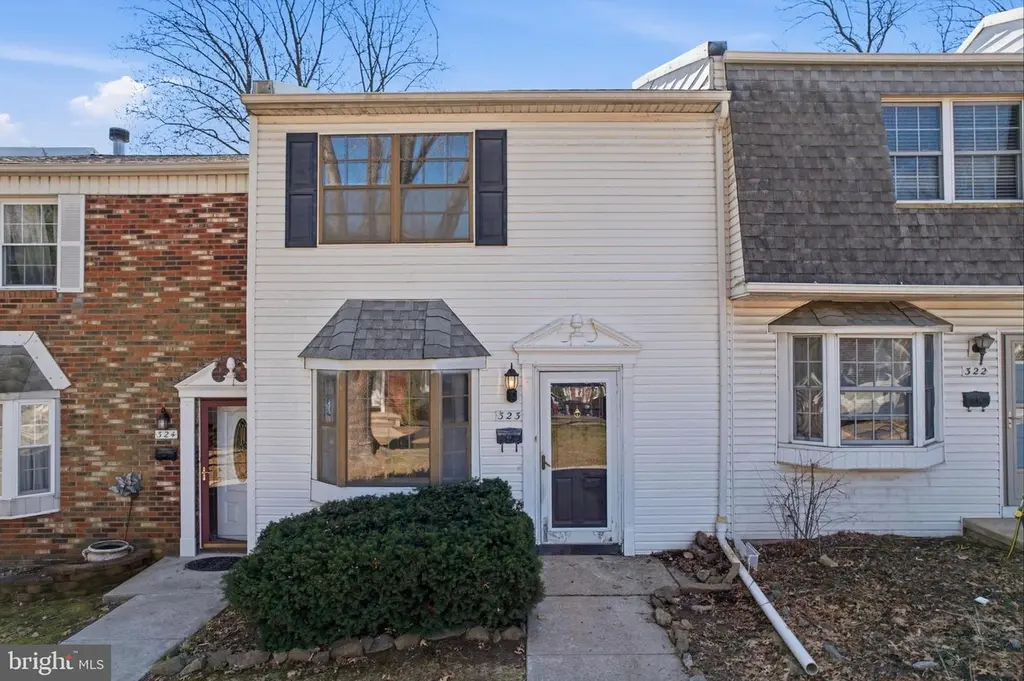
323 Harvard Sq · Croydon, PA
Flood risk 1/10 · Minimal
- FEMA flood zone
- X (unshaded)
- Chance of flooding over 30 yrs
- 0.0%
- Est. flood insurance / yr
- $473 – $860
Fire risk 1/10 · Minimal
- Est. fire insurance / yr
- $511 – $949
Heat risk 7/10 · Major
- Hot days now (above 104°F)
- 7 days/yr
- Hot days in 30 yrs
- 15 days/yr
Wind risk 6/10 · Moderate
- Chance of severe wind over 30 yrs
- 27.0%
Air-quality risk 5/10 · Moderate
- Unhealthy air days now
- 6 days/yr
- Unhealthy air days in 30 yrs
- 8 days/yr
Risk factors via First Street. Map © Google.
Why this score? — see what drove the D grade
The composite is a weighted blend of 9 inputs, each scored 0–100. Each bar is that input's sub-score; the figure is the points it added to the 100-point composite (weight × sub-score).
- ARV discount +15.0/15.0
- Cash flow +8.1/30.0
- Rent growth +4.0/5.0
- 1% rule +3.7/10.0
- Livability +3.6/5.0
- Schools +2.5/10.0
- Condition / age +2.5/5.0
- DSCR +2.1/10.0
- Appreciation +0.0/10.0
$269,900
🖨 Deal sheet 📄 Offer letter ✓ Due diligence
Listing remarks MLS
Handyman Special! Instant Equity To Be Earned! Welcome to this 2-bedroom, 1.5-bath home located on a quiet residential street in Southwest Philadelphia. This home needs some TLC but has so much potential! This property offers a comfortable layout with a spacious living area, nicely sized bedrooms, and a functional kitchen ready for your personal touches. The home also features a good-sized basement, perfect for storage, a workshop, or the potential to finish for additional living space. With solid structure and great potential, this property is ideal for first-time homebuyers or investors looking to add value. Conveniently located near public transportation, local schools, parks, and shopping, providing easy access to Center City and surrounding neighborhoods. Property is being sold in as-is condition. Call today!
Key facts
- Functional kitchen
- Spacious living area
- Good-sized basement
Tags
Neighborhood map
What this means for you Summary
Snapshot
- This is a 3-bed/1.5-bath townhouse listed at $270k.
Deal economics
- At list price, monthly cash flow is $-269 ($-3k/yr) — negative.
- To cash-flow at today's rent, offer at most $222k (17.6% below list).
- To meet the 1% rule (rent ≥ 1% of price), the offer needs to be $236k (12.5% below list).
- Recommended offer: $222k (17.6% below list) — sets the bar for cash-flow.
- Cap rate 5.1% vs local median 4.2% in Croydon — meaningfully above typical; check what's discounted (condition, days-on-market, listing class) to confirm the premium yield is real.
Location & tenants
- Location reads 71/100 on livability (#695 in PA) — a middle-class / working-renter tenant base. Strengths: cost of living A+, housing A+, crime B+; Watch: schools D+, amenities F, health & safety F.
- Bensalem Township SD (suburban): math 21% / reading 34% proficiency, ranked #447 of 539 in PA (top 83%) — low school quality limits family demand, transient renter base, plan for 1-2y turnover.
- Market conditions: Rents rising fast (+6.1%/yr); 147 active listings in the ZIP; 9 comparable units currently listed for rent nearby; rentals at typical pace (median 18d on market — plan ~3-4 weeks tenant-placement turnaround); solid renter incomes; 663 units permitted in Bucks County in 2024 (106 in 5+ unit buildings).
- This rent runs 34% of the median local income ($83k/yr) — at the standard rent-burdened threshold; future hikes will face affordability resistance.
Forward outlook
- Local home prices are declining (-3.0%/yr); year-one equity from $2k of loan paydown is wiped out by about $8k of value loss. Plan a longer hold.
- Bucks County population projected to shrink 7% by 2050 — rents likely to lag national; underwrite the cash flow, not the appreciation.
Negotiation context
- It's been on market 39 days — a 3% lower offer ($262k) is reasonable based on typical stale-listing flexibility.
- Current owner paid $220k; 23% above their basis — modest negotiation headroom, anchor on the comps not their cost.
Risks & watch-outs
- Climate carrying-cost: major wind risk, 27% chance of damaging wind over 30y; extreme-heat days projected 7→15/yr by 2055 (HVAC capex compounding) — expect insurance premiums to compound above CPI over the hold.
Questions for the listing agent
- What do current leases actually rent for vs. the listed asking? Can we see a recent rent roll and the last 12 months of T-12 income?
- It's been on market 39 days. Have you received any prior offers? Is the seller open to a 18% concession, seller financing, or rate buy-down credit?
- Built in 1974 — when were the roof, HVAC, electrical panel, plumbing, and water heater last replaced?
- What does the HOA fee cover, when was the last increase, and are there any pending special assessments or reserve-fund shortfalls?
- Is there a deadline driving the sale (1031 exchange, divorce, estate, relocation)? That informs how much negotiation room exists.
- Schools are D-rated, which usually means shorter tenancies and higher turnover. Who's the typical renter profile here, and what's been the actual vacancy rate?
- The area grade is low — what's the realistic commute time and amenity access for the typical tenant pool here? Any planned neighborhood developments (good or bad) we should know about?
- What's the average days-on-market for RENTAL listings here right now (not sales)? A rising rental-DOM trend means longer vacancies and softer asking-rent achievability than the comps imply.
- What's the recent tenant-quality profile in this submarket — average credit score on applications, eviction rate, late-payment / NSF rate, and stable-employment percentage? A property-management company in the area should have these aggregated.
- How much new for-sale + rental construction is in the pipeline within 1–3 miles? Heavy new supply typically softens prices + rents 12–24 months out; constrained supply supports both.
Investment metrics
- 1% rule
- 0.87% ✗
- Cap rate
- 5.10%
- Cash-on-cash
- -4.27%
- DSCR
- 0.81
- GRM
- 9.5
CMA / ARV
- ARV (median comp)
- $351,432
- List price
- $269,900
- Delta
- -23.20%
- Verdict
- UNDERPRICED
- Comps
- 20 within 1.0 mi
Show comp detail 10 sales within ~0.75 mi
| Address | Dist | Beds/Ba | Sqft | Sold | Price | $/sf | Match |
|---|---|---|---|---|---|---|---|
| 323 Harvard Sq | 0.00mi | 2/1.5 (-1) | 1,188 (0%) | 0mo | $270,000 | $227 | 95 |
| 423 N Mount Vernon Cir | 0.14mi | 3/1.5 | 1,188 (0%) | 4mo | $315,000 | $265 | 90 |
| 446 N Mount Vernon Cir | 0.06mi | 2/1.5 (-1) | 1,188 (0%) | 7mo | $339,000 | $285 | 86 |
| 393 Rutgers Ct | 0.09mi | 2/1.5 (-1) | 1,188 (0%) | 8mo | $275,000 | $231 | 84 |
| 389 Rutgers Ct | 0.09mi | 3/1.5 | 1,122 (-6%) | 6mo | $332,000 | $296 | 81 |
| 435 N Mount Vernon Cir | 0.13mi | 2/1.5 (-1) | 1,188 (0%) | 11mo | $330,000 | $278 | 80 |
| 348 Dartmouth Ct | 0.04mi | 4/1.5 (+1) | 1,188 (0%) | 22mo | $350,000 | $295 | 75 |
| 359 Dartmouth Ct | 0.05mi | 2/1.5 (-1) | 1,122 (-6%) | 12mo | $325,000 | $290 | 73 |
| 367 Dartmouth Ct | 0.06mi | 3/2.5 | 1,320 (+11%) | 2mo | $355,000 | $269 | 73 |
| 339 N Mount Vernon Cir | 0.05mi | 3/2.5 | 1,320 (+11%) | 9mo | $399,000 | $302 | 68 |
Match score weights: distance 35% · size 25% · config 20% · recency 20%. Top-matched comps best support the ARV.
Projected returns pro-forma
-3.0% appreciation · 6.14% rent growth · sell at horizon
- IRR
- -19.4%
- Equity multiple
- 0.30×
- Total profit
- $-52,971
- Equity at exit
- $40,243
- IRR
- -6.0%
- Equity multiple
- 0.55×
- Total profit
- $-33,688
- Equity at exit
- $23,336
Cash invested: $75,572 (down + closing). Projections, not guarantees.
Landlord ↔ Tenant lean methodology
- Overall (STATE)
- 62 Landlord-Friendly
- State Pennsylvania
- 62 Landlord-Friendly · EVEN
- County
- — inherits STATE
- City
- — inherits STATE
ZIP-level market 19020
- Rents YoY
- 6.1%
- Active inventory
- 147
- Price-to-rent
- 9.5×
Monthly cashflow live
- Estimated rent
- $2,361 high interval (Pro) →
- Mortgage (P&I)
- −$1,415
- Tax from tax record
- −$303 /mo · $3,631/yr
- Insurance
- −$112
- HOA
- −$304
- Vacancy / Maint / Mgmt
- −$496
- Net cashflow
- $-269
Break-even live
UW: 25.0% down · 7.5% · 30yr · 1.5% tax · 5.0% vac · 8.0% maint · 8.0% mgmt
Financing live
Cash to close
- Down payment
- $67,475
- Closing costs
- $8,097
- Reserves months
- —
- Total cash needed
- —
Loan-product check · same deal, 3 products live
Conventional
25% down · 7.5% · 30yr
- Down + closing
- —
- Monthly P&I
- —
- Monthly cashflow
- —
- DSCR
- —
- Eligible?
- —
Personal DTI + credit; lowest rate.
DSCR
20% down · 8.5% · 30yr
- Down + closing
- —
- Monthly P&I
- —
- Monthly cashflow
- —
- DSCR
- —
- Eligible?
- —
No personal income docs; deal must DSCR.
Hard money
10% down · 12.0% · 12mo
- Down + closing
- —
- Monthly P&I
- —
- Monthly cashflow
- —
- DSCR
- —
- Eligible?
- —
Short-term bridge; refi at stabilization.
Rent comps 9 comps
| Address | Beds | Baths | Sqft | Rent | $/sqft | DOM | Units | Dist |
|---|---|---|---|---|---|---|---|---|
| 423 N Mount Vernon Cir Bensalem, PA | 3.0 | 1.5 | 1188 | $2,480 | $2.09 | 1d | 1 | 0.16mi |
| 1100 Newportville Rd Croydon, PA | 2.0 | 1.0 | 705 | $1,830 | $2.60 | 1d | 31 | 0.52mi |
| 735 Newportville Rd Croydon, PA | 2.0 | 1.0 | 1344 | $2,400 | $1.79 | 43d | 1 | 0.68mi |
| 132 Hillcrest Ave Croydon, PA | 4.0 | 1.5 | 1282 | $2,800 | $2.18 | 1d | 1 | 0.97mi |
| 909 Bristol Pike Croydon, PA | 2.0 | 1.0 | 730 | $1,400 | $1.92 | 43d | 1 | 0.99mi |
| 1000 Main Ave Croydon, PA | 3.0 | 2.0 | 1470 | $2,800 | $1.90 | 18d | 1 | 1.27mi |
| 3806 Bensalem Blvd Bensalem, PA | 1.0–3.0 | 1.0–2.0 | 1001 | $2,700 | $2.70 | 1d | 1 | 1.45mi |
| 4007 Hulmeville Rd Bensalem, PA | 3.0 | 1.0 | 1500 | $2,250 | $1.50 | 24d | 1 | 1.45mi |
| 1940 Arrowood Dr Bensalem, PA | 3.0 | 2.5 | 1344 | $2,800 | $2.08 | 43d | 1 | 1.48mi |
HOA detail
- Monthly dues
- $304 · $3,648/yr
Listing history 3 events
-
2026-04-28price $269,900 825-char remark
Show marketing remark (825 chars)
Handyman Special! Instant Equity To Be Earned! Welcome to this 2-bedroom, 1.5-bath home located on a quiet residential street in Southwest Philadelphia. This home needs some TLC but has so much potential! This property offers a comfortable layout with a spacious living area, nicely sized bedrooms, and a functional kitchen ready for your personal touches. The home also features a good-sized basement, perfect for storage, a workshop, or the potential to finish for additional living space. With solid structure and great potential, this property is ideal for first-time homebuyers or investors looking to add value. Conveniently located near public transportation, local schools, parks, and shopping, providing easy access to Center City and surrounding neighborhoods. Property is being sold in as-is condition. Call today!
-
2026-04-16$275,000 Active 825-char remark
Show marketing remark (825 chars)
Handyman Special! Instant Equity To Be Earned! Welcome to this 2-bedroom, 1.5-bath home located on a quiet residential street in Southwest Philadelphia. This home needs some TLC but has so much potential! This property offers a comfortable layout with a spacious living area, nicely sized bedrooms, and a functional kitchen ready for your personal touches. The home also features a good-sized basement, perfect for storage, a workshop, or the potential to finish for additional living space. With solid structure and great potential, this property is ideal for first-time homebuyers or investors looking to add value. Conveniently located near public transportation, local schools, parks, and shopping, providing easy access to Center City and surrounding neighborhoods. Property is being sold in as-is condition. Call today!
-
2026-02-25soldstatus $220,000
ⓘ Source: listings_history table (triggers on properties + properties_extension) + one-shot
backfill from property_details.listing_events for pre-trigger history.
Tax reassessment forecast PA · Partial reset (capped growth)
- Current annual tax
- $3,631 · $303/mo
- Projected year-2 tax
- $3,948 · $329/mo
- Expected delta
- +$317/yr (+$26/mo · 8.7%)
ⓘ Screening estimate from a state-policy table — verify with the county assessor before closing.
Climate risk First Street
- Flood 1/10 Low FEMA zone X (unshaded) · 0% chance over 30 yrs
- Wildfire 1/10 Low
- Heat 7/10 Severe 7 d/yr ≥104°F today · 15 d/yr by 30 yrs out
- Wind 6/10 Major 27% chance of damaging wind over 30 yrs
- Air quality 5/10 Major 6 unhealthy d/yr today · 8 by 30 yrs out
Nearby sold comps map
Loading sold comps map…
Walkable amenities ~0.75 mi
Loading nearby amenities…
Taxation est. · year 1
- Rental income
- $28,336
- − Mortgage interest
- −$15,119
- − Property taxes
- −$3,631
- − Insurance
- −$1,350
- − Repairs & maintenance
- −$2,267
- − Management
- −$2,267
- − HOA
- −$3,648
- − Depreciation
- −$7,852
- Taxable loss
- −$7,797
- Est. tax savings @ 24.0%
- +$1,871
- After-tax cash flow
- $-1,357/yr
For passive investors: Depreciation is non-cash, so a rental often shows a tax loss while cash-flowing — sheltering income. Rental losses are passive: they offset passive income freely, and up to $25,000/yr can offset ordinary (W-2) income if you actively participate and your MAGI is under $100k (phasing out to $0 by $150k); unused losses carry forward. On sale, claimed depreciation is recaptured at up to 25%, and gains may owe capital-gains tax (a 1031 exchange can defer both). Figures are a year-1 estimate at your 24.0% rate — not tax advice; consult a CPA.
Schools (NCES district)
- District
- Bensalem Township SD
- NCES district ID
- 4203330
- Math proficiency
- 21% ▼ -16.00%
- Reading proficiency
- 34% ▼ -19.00%
- Median HH income
- $59,936
- Composite
- 25.03/100
- National rank
- #7554
- State rank
- #447 of 539 in PA
Livability — Croydon
- Score
- 71/100
- State rank
- #695
- US rank
- #6818
Category grades
Schools grade is shown separately in the Schools card above.
Census & demographics
- County
- Bucks County · 506,477 people
- City population
- 9,638
- Metro
- Philadelphia-Camden-Wilmington, PA-NJ-DE-MD
- Population (ZIP)
- 56,809
- Household income
- $83,223
- Rent vs Own
- Severe rent burden
- 2323.0
Population outlook (Bucks County) Hauer SSP2
- Today (2025)
- 630,973 people
- By 2030
- 627,093 · -0.6%
- By 2040
- 609,680 · -3.4%
- By 2050
- 584,225 · -7.4%
- By 2075
- 539,840 · -14.4%
- By 2100
- 483,970 · -23.3%
Race, ethnicity, and origin ACS 2023
- Neighborhood character
- Diverse neighborhood (Simpson 0.56)
- Race & ethnicity
- White 63% Hispanic / Latino 13% Asian 13% Two or more races 8% Black 7%
- Hispanic origin (detail)
- Mexican 4% Puerto Rican 4%
- Common ancestry
- Romanian 7% Subsaharan African 2% Scotch-Irish 1%
- Foreign-born
- 20% · Canada, China, South Korea
- Languages at home
- 74% English-only · Other Indo-European 10% Spanish 9% Russian/Polish/Slavic 3%
Political lean MEDSL · Bucks
- 2024 margin
- Toss-up / Even · D 49.5% · R 49.5%
- 2008→2024 swing
- -8.7pp toward R · 2008: 8.7pp · 2024: -0.1pp
- All cycles
- 2024: R+0.1 2020: D+4.4 2016: D+0.6 2012: D+1.2 2008: D+8.7
Not yet ingested
- Civics
- —
Market trends
- HPI YoY
- ▼ -363.70%
- Current HPI
- 284.9207
- Rent YoY
- ▲ 6.14%
- Metro
- Philadelphia-Camden-Wilmington, PA-NJ-DE-MD
- State GDP YoY
- ▲ 1.68%
- F500 in state
- 34
Industry mix (Fortune 500 HQ in PA)
| Industry | F500 HQs | Revenue |
|---|---|---|
| Healthcare | 2 | $309B |
|
||
| Insurance | 2 | $27B |
|
||
| Telecommunications / Media | 1 | $124B |
|
||
| Industrial Distribution | 1 | $22B |
|
||
| Financial Services | 1 | $20B |
|
||
| Chemicals / Materials | 1 | $18B |
|
||
Price history
+22.7% since first listed3 events — show timeline
- 2026-04-28 Price Changed $269,900 BRIGHT MLS
- 2026-04-16 Listed $275,000 BRIGHT MLS
- 2026-02-25 Sold (Public Records) $220,000 Public Records
Property tax history
+1.7%/yrLatest (2026): $3,631 · +2.8% YoY. Source: county tax records.
Cash-flow waterfall
monthlySold comps — $/sqft
last 12 mo · ≤1 miLoading sold comps…