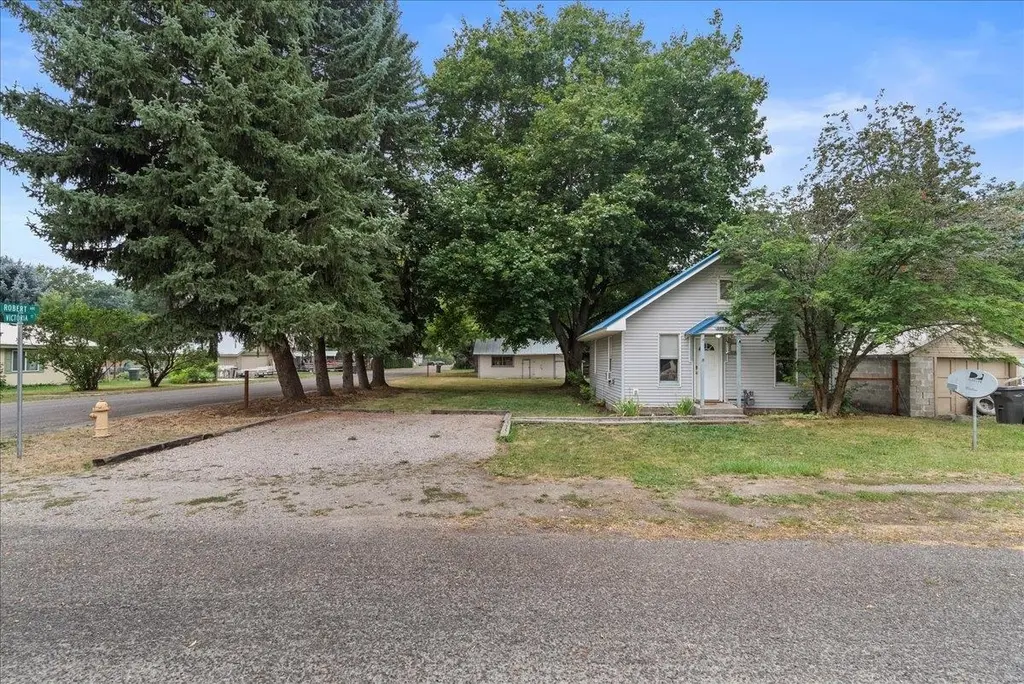
208 S Victoria St
Chewelah, WA 99109
$179,000D-
2 bd · 1.0 ba ·
736 sqft ·
Built 1999
· SingleFamily
· Active
· 76 DOM
Cashflow @ list (25.0% down · 7.5%)
Estimated rent
$1,131/mo
Mortgage (P&I)
−$939
Tax + insurance
−$169
HOA
−$0
Vac / Maint / Mgmt
−$237
Net cashflow
$-214/mo
Annual
$-2,573/yr
Cap rate
4.86%
Cash-on-cash
-5.13%
DSCR
0.77
1% rule
0.63%
Cash to close
$50,120
Investor read
- This is a 2-bed/1.0-bath single-family listed at $179k.
- At list price, monthly cash flow is $-214 ($-3k/yr) — negative.
- To cash-flow at today's rent, offer at most $141k (21.2% below list).
- To meet the 1% rule (rent ≥ 1% of price), the offer needs to be $113k (36.8% below list).
- It's been on market 76 days — a 6% lower offer ($168k) is reasonable based on typical stale-listing flexibility.
- Recommended offer: $113k (36.8% below list) — sets the bar for 1% rule.
- Local home prices are declining (-3.0%/yr); year-one equity from $1k of loan paydown is wiped out by about $5k of value loss. Plan a longer hold.
- Location reads 78/100 on livability (#116 in WA, #2,374 nationally) — a middle-class / working-renter tenant base. Strengths: amenities A+, cost of living A+, housing A+; Watch: employment D+, commute F.
- Chewelah School District (rural): math 39% / reading 63% proficiency, ranked #153 of 291 in WA (top 53%) — acceptable for families but not a draw, mixed tenant base, ~2y average lease.
- Market conditions: 132 active listings in the ZIP; 341 units permitted in Stevens County in 2024 (72 in 5+ unit buildings).
- Stevens County population projected at -12% by 2050 — secular population decline; favor cash flow + early exit over multi-decade hold.
- 4 sale attempts since 4y ago with the ask held roughly flat each time — persistent listings suggest the price (not the market) is what's stuck; bring a comps-based counter.
- Current owner paid $50k; list at $179k implies a 258% gain — meaningful room to come down on a strong offer.
- Climate carrying-cost: major wildfire risk — expect insurance premiums to compound above CPI over the hold.
- Cap rate 4.9% vs local median 1.7% in Chewelah — top-decile yield for the area; either an underpriced asset or a hidden risk that comps aren't pricing in. Stress-test before assuming the spread holds.
Questions for listing agent
- What do current leases actually rent for vs. the listed asking? Can we see a recent rent roll and the last 12 months of T-12 income?
- It's been on market 76 days. Have you received any prior offers? Is the seller open to a 37% concession, seller financing, or rate buy-down credit?
- Why hasn't it sold? Are there any deal-killer items the seller is aware of (foundation, flood, title, zoning, code violations)?
- Is there a deadline driving the sale (1031 exchange, divorce, estate, relocation)? That informs how much negotiation room exists.
- The area grade is low — what's the realistic commute time and amenity access for the typical tenant pool here? Any planned neighborhood developments (good or bad) we should know about?
- What's the average days-on-market for RENTAL listings here right now (not sales)? A rising rental-DOM trend means longer vacancies and softer asking-rent achievability than the comps imply.
- What's the recent tenant-quality profile in this submarket — average credit score on applications, eviction rate, late-payment / NSF rate, and stable-employment percentage? A property-management company in the area should have these aggregated.
- How much new for-sale + rental construction is in the pipeline within 1–3 miles? Heavy new supply typically softens prices + rents 12–24 months out; constrained supply supports both.
CashFlowRE · CFR-R1C0H94YE3X8X3
· Data 2 days ago
cashflowre.app · 2026-05-29