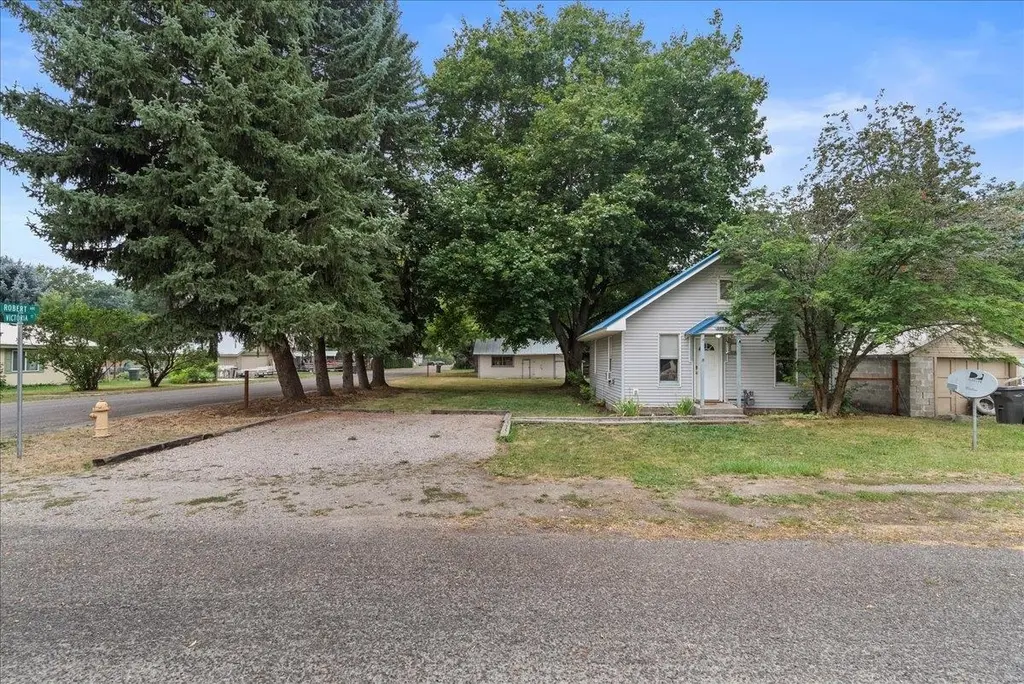
208 S Victoria St · Chewelah, WA
Flood risk 2/10 · Minimal
- FEMA flood zone
- X
- Chance of flooding over 30 yrs
- 0.09%
- Est. flood insurance / yr
- $507 – $1,088
Fire risk 7/10 · Major
- Est. fire insurance / yr
- $604 – $1,122
Heat risk 3/10 · Minor
- Hot days now (above 96°F)
- 7 days/yr
- Hot days in 30 yrs
- 16 days/yr
Wind risk 1/10 · Minimal
- Chance of severe wind over 30 yrs
- —
Air-quality risk 9/10 · Severe
- Unhealthy air days now
- 14 days/yr
- Unhealthy air days in 30 yrs
- 16 days/yr
Risk factors via First Street. Map © Google.
Why this score? — see what drove the D- grade
The composite is a weighted blend of 9 inputs, each scored 0–100. Each bar is that input's sub-score; the figure is the points it added to the 100-point composite (weight × sub-score).
- ARV discount +15.0/15.0
- Cash flow +7.6/30.0
- Schools +4.4/10.0
- Livability +3.9/5.0
- Rent growth +2.5/5.0
- Condition / age +2.5/5.0
- DSCR +1.7/10.0
- 1% rule +1.3/10.0
- Appreciation +0.0/10.0
$179,000
🖨 Deal sheet 📄 Offer letter ✓ Due diligence
Listing remarks MLS
Charming one-level home on a spacious corner lot in the heart of Chewelah! Inside you’ll find a bright living room with beautiful dark flooring that flows into the main bedroom, a roomy kitchen, and a full bath. Vinyl siding and a durable metal roof keep maintenance easy, while off-street parking adds convenience. The detached garage at the back of the lot offers single-car parking, a workbench, storage, and even an insulated cold room. Plenty of potential remains with space to expand if desired. Mature trees along the south side provide privacy and welcome shade. A comfortable home with room to grow.
Key facts
- Durable metal roof
- Insulated cold room
- Bright living room
Tags
Neighborhood map
What this means for you Summary
Snapshot
- This is a 2-bed/1.0-bath single-family listed at $179k.
Deal economics
- At list price, monthly cash flow is $-214 ($-3k/yr) — negative.
- To cash-flow at today's rent, offer at most $141k (21.2% below list).
- To meet the 1% rule (rent ≥ 1% of price), the offer needs to be $113k (36.8% below list).
- Recommended offer: $113k (36.8% below list) — sets the bar for 1% rule.
- Cap rate 4.9% vs local median 1.7% in Chewelah — top-decile yield for the area; either an underpriced asset or a hidden risk that comps aren't pricing in. Stress-test before assuming the spread holds.
Location & tenants
- Location reads 78/100 on livability (#116 in WA, #2,374 nationally) — a middle-class / working-renter tenant base. Strengths: amenities A+, cost of living A+, housing A+; Watch: employment D+, commute F.
- Chewelah School District (rural): math 39% / reading 63% proficiency, ranked #153 of 291 in WA (top 53%) — acceptable for families but not a draw, mixed tenant base, ~2y average lease.
- Market conditions: 132 active listings in the ZIP; 341 units permitted in Stevens County in 2024 (72 in 5+ unit buildings).
Forward outlook
- Local home prices are declining (-3.0%/yr); year-one equity from $1k of loan paydown is wiped out by about $5k of value loss. Plan a longer hold.
- Stevens County population projected at -12% by 2050 — secular population decline; favor cash flow + early exit over multi-decade hold.
Negotiation context
- It's been on market 76 days — a 6% lower offer ($168k) is reasonable based on typical stale-listing flexibility.
- 4 sale attempts since 4y ago with the ask held roughly flat each time — persistent listings suggest the price (not the market) is what's stuck; bring a comps-based counter.
- Current owner paid $50k; list at $179k implies a 258% gain — meaningful room to come down on a strong offer.
Risks & watch-outs
- Climate carrying-cost: major wildfire risk — expect insurance premiums to compound above CPI over the hold.
Questions for the listing agent
- What do current leases actually rent for vs. the listed asking? Can we see a recent rent roll and the last 12 months of T-12 income?
- It's been on market 76 days. Have you received any prior offers? Is the seller open to a 37% concession, seller financing, or rate buy-down credit?
- Why hasn't it sold? Are there any deal-killer items the seller is aware of (foundation, flood, title, zoning, code violations)?
- Is there a deadline driving the sale (1031 exchange, divorce, estate, relocation)? That informs how much negotiation room exists.
- The area grade is low — what's the realistic commute time and amenity access for the typical tenant pool here? Any planned neighborhood developments (good or bad) we should know about?
- What's the average days-on-market for RENTAL listings here right now (not sales)? A rising rental-DOM trend means longer vacancies and softer asking-rent achievability than the comps imply.
- What's the recent tenant-quality profile in this submarket — average credit score on applications, eviction rate, late-payment / NSF rate, and stable-employment percentage? A property-management company in the area should have these aggregated.
- How much new for-sale + rental construction is in the pipeline within 1–3 miles? Heavy new supply typically softens prices + rents 12–24 months out; constrained supply supports both.
Investment metrics
- 1% rule
- 0.63% ✗
- Cap rate
- 4.86%
- Cash-on-cash
- -5.13%
- DSCR
- 0.77
- GRM
- 13.2
CMA / ARV
- ARV (median comp)
- $233,284
- List price
- $179,000
- Delta
- -23.27%
- Verdict
- UNDERPRICED
- Comps
- 15 within 1.0 mi
Show comp detail 4 sales within ~0.75 mi
| Address | Dist | Beds/Ba | Sqft | Sold | Price | $/sf | Match |
|---|---|---|---|---|---|---|---|
| 605 W King Ave | 0.13mi | 3/1.0 (+1) | 737 (+0%) | 6mo | $50,000 | $68 | 84 |
| 613 W King Ave | 0.11mi | 2/1.0 | 800 (+9%) | 3mo | $235,500 | $294 | 78 |
| 504 W Robert Ave | 0.16mi | 3/1.0 (+1) | 818 (+11%) | 4mo | $237,000 | $290 | 66 |
| 805 W Main Ave | 0.11mi | 2/1.0 | 840 (+14%) | 13mo | $235,000 | $280 | 60 |
Match score weights: distance 35% · size 25% · config 20% · recency 20%. Top-matched comps best support the ARV.
Projected returns pro-forma
-3.0% appreciation · 3.0% rent growth · sell at horizon
- IRR
- -25.1%
- Equity multiple
- 0.15×
- Total profit
- $-42,722
- Equity at exit
- $26,689
- IRR
- -21.2%
- Equity multiple
- -0.10×
- Total profit
- $-55,037
- Equity at exit
- $15,477
Cash invested: $50,120 (down + closing). Projections, not guarantees.
Landlord ↔ Tenant lean methodology
- Overall (STATE)
- 28 Tenant-Leaning
- State Washington
- 28 Tenant-Leaning · D+8
- County
- — inherits STATE
- City
- — inherits STATE
ZIP-level market 99109
- Home prices YoY
- -19.2%
- Active inventory
- 132
- Price-to-rent
- 13.2×
Monthly cashflow live
- Estimated rent
- $1,131 medium interval (Pro) →
- Mortgage (P&I)
- −$939
- Tax from tax record
- −$94 /mo · $1,134/yr
- Insurance
- −$75
- HOA
- −$0
- Vacancy / Maint / Mgmt
- −$237
- Net cashflow
- $-214
Break-even live
UW: 25.0% down · 7.5% · 30yr · 1.5% tax · 5.0% vac · 8.0% maint · 8.0% mgmt
Financing live
Cash to close
- Down payment
- $44,750
- Closing costs
- $5,370
- Reserves months
- —
- Total cash needed
- —
Loan-product check · same deal, 3 products live
Conventional
25% down · 7.5% · 30yr
- Down + closing
- —
- Monthly P&I
- —
- Monthly cashflow
- —
- DSCR
- —
- Eligible?
- —
Personal DTI + credit; lowest rate.
DSCR
20% down · 8.5% · 30yr
- Down + closing
- —
- Monthly P&I
- —
- Monthly cashflow
- —
- DSCR
- —
- Eligible?
- —
No personal income docs; deal must DSCR.
Hard money
10% down · 12.0% · 12mo
- Down + closing
- —
- Monthly P&I
- —
- Monthly cashflow
- —
- DSCR
- —
- Eligible?
- —
Short-term bridge; refi at stabilization.
Listing history 25 events
-
2026-06-18days on market $179,000 Active 76 DOM
-
2026-06-17days on market $179,000 Active 75 DOM
-
2026-06-16days on market $179,000 Active 74 DOM
-
2026-06-15days on market $179,000 Active 73 DOM
-
2026-06-15days on market $179,000 Active 72 DOM
-
2026-06-13days on market $179,000 Active 71 DOM
-
2026-06-12days on market $179,000 Active 70 DOM
-
2026-06-09days on market $179,000 Active 67 DOM
-
2026-06-08days on market $179,000 Active 66 DOM
-
2026-06-08days on market $179,000 Active 65 DOM
-
2026-06-07days on market $179,000 Active 64 DOM
-
2026-06-03days on market $179,000 Active 61 DOM
-
2026-06-02days on market $179,000 Active 60 DOM
-
2026-06-01days on market $179,000 Active 59 DOM
-
2026-05-31days on market $179,000 Active 58 DOM
-
2026-04-03historical
Show marketing remark (614 chars)
Charming one-level home on a spacious corner lot in the heart of Chewelah! Inside you’ll find a bright living room with beautiful dark flooring that flows into the main bedroom, a roomy kitchen, and a full bath. Vinyl siding and a durable metal roof keep maintenance easy, while off-street parking adds convenience. The detached garage at the back of the lot offers single-car parking, a workbench, storage, and even an insulated cold room. Plenty of potential remains with space to expand if desired. Mature trees along the south side provide privacy and welcome shade. A comfortable home with room to grow.
-
2026-04-03$179,000 Active 614-char remark
Show marketing remark (614 chars)
Charming one-level home on a spacious corner lot in the heart of Chewelah! Inside you’ll find a bright living room with beautiful dark flooring that flows into the main bedroom, a roomy kitchen, and a full bath. Vinyl siding and a durable metal roof keep maintenance easy, while off-street parking adds convenience. The detached garage at the back of the lot offers single-car parking, a workbench, storage, and even an insulated cold room. Plenty of potential remains with space to expand if desired. Mature trees along the south side provide privacy and welcome shade. A comfortable home with room to grow.
-
2026-01-13$199,900 Active
-
2025-12-31historical
-
2025-09-09$199,900 Active
-
2022-10-01historical
-
2022-08-23price $245,000
-
2022-06-23$259,900 New
-
2018-03-07soldstatus $50,000
-
2004-09-17soldstatus $50,000
ⓘ Source: listings_history table (triggers on properties + properties_extension) + one-shot
backfill from property_details.listing_events for pre-trigger history.
Tax reassessment forecast WA · Resets to sale price
- Current annual tax
- $1,134 · $94/mo
- Projected year-2 tax
- $1,754 · $146/mo
- Expected delta
- +$621/yr (+$52/mo · 54.8%)
ⓘ Screening estimate from a state-policy table — verify with the county assessor before closing.
Climate risk First Street
- Flood 2/10 Low FEMA zone X · 9% chance over 30 yrs
- Wildfire 7/10 Severe
- Heat 3/10 Moderate 7 d/yr ≥96°F today · 16 d/yr by 30 yrs out
- Wind 1/10 Low
- Air quality 9/10 Extreme 14 unhealthy d/yr today · 16 by 30 yrs out
Nearby sold comps map
Loading sold comps map…
Walkable amenities ~0.75 mi
Loading nearby amenities…
Taxation est. · year 1
- Rental income
- $13,570
- − Mortgage interest
- −$10,027
- − Property taxes
- −$1,134
- − Insurance
- −$895
- − Repairs & maintenance
- −$1,086
- − Management
- −$1,086
- − Depreciation
- −$5,207
- Taxable loss
- −$5,864
- Est. tax savings @ 24.0%
- +$1,407
- After-tax cash flow
- $-1,165/yr
For passive investors: Depreciation is non-cash, so a rental often shows a tax loss while cash-flowing — sheltering income. Rental losses are passive: they offset passive income freely, and up to $25,000/yr can offset ordinary (W-2) income if you actively participate and your MAGI is under $100k (phasing out to $0 by $150k); unused losses carry forward. On sale, claimed depreciation is recaptured at up to 25%, and gains may owe capital-gains tax (a 1031 exchange can defer both). Figures are a year-1 estimate at your 24.0% rate — not tax advice; consult a CPA.
Schools (NCES district)
- District
- Chewelah School District
- NCES district ID
- 5301260
- Math proficiency
- 39% ▼ -9.00%
- Reading proficiency
- 63% ▬ 0.00%
- Median HH income
- $36,173
- Composite
- 44.23/100
- National rank
- #6191
- State rank
- #153 of 291 in WA
Livability — Chewelah
- Score
- 78/100
- State rank
- #116
- US rank
- #2374
Category grades
Schools grade is shown separately in the Schools card above.
Census & demographics
- Census place
- Chewelah, WA
- Population (ZIP)
- 5,075
Population outlook (Stevens County) Hauer SSP2
- Today (2025)
- 43,696 people
- By 2030
- 43,203 · -1.1%
- By 2040
- 41,190 · -5.7%
- By 2050
- 38,231 · -12.5%
- By 2075
- 31,260 · -28.5%
- By 2100
- 22,931 · -47.5%
Race, ethnicity, and origin ACS 2023
- Neighborhood character
- Predominantly White (84%)
- Race & ethnicity
- White 84% Two or more races 8% Native American 3% Hispanic / Latino 2% Pacific Islander 1%
- Common ancestry
- Portuguese 6% Italian 4% Lithuanian 2%
- Foreign-born
- 1% · Canada
- Languages at home
- 98% English-only · Spanish 1%
Political lean MEDSL · Stevens
- 2024 margin
- Solid R (+44.1) · D 26.7% · R 70.8% · Other 2.5%
- 2008→2024 swing
- -23.4pp toward R · 2008: -20.7pp · 2024: -44.1pp
- All cycles
- 2024: R+44.1 2020: R+42.1 2016: R+40.8 2012: R+27.7 2008: R+20.7
Not yet ingested
- Civics
- —
Market trends
- HPI YoY
- ▼ -74.63%
- Current HPI
- 313.3997
- Rent YoY
- —
- Metro
- —
- State GDP YoY
- ▲ 4.65%
- F500 in state
- 22
Industry mix (Fortune 500 HQ in WA)
| Industry | F500 HQs | Revenue |
|---|---|---|
| Retail | 2 | $269B |
|
||
| Technology / Retail | 1 | $638B |
|
||
| Technology | 1 | $245B |
|
||
| Telecommunications | 1 | $38B |
|
||
| Food / Beverage | 1 | $36B |
|
||
| Automotive / Trucks | 1 | $34B |
|
||
Price history
+258.0% since first listed10 events — show timeline
- 2026-04-03 Listed $179,000 SPOKANEMLS as Distributed by MLS Grid
- 2026-04-03 Listing Removed — SPOKANEMLS as Distributed by MLS Grid
- 2026-01-13 Listed $199,900 SPOKANEMLS as Distributed by MLS Grid
- 2025-12-31 Listing Removed — SPOKANEMLS as Distributed by MLS Grid
- 2025-09-09 Listed $199,900 SPOKANEMLS as Distributed by MLS Grid
- 2022-10-01 Listing Removed — SPOKANEMLS as Distributed by MLS Grid
- 2022-08-23 Price Changed $245,000 SPOKANEMLS as Distributed by MLS Grid
- 2022-06-23 Listed $259,900 SPOKANEMLS as Distributed by MLS Grid
- 2018-03-07 Sold (Public Records) $50,000 Public Records
- 2004-09-17 Sold (Public Records) $50,000 Public Records
Property tax history
+5.0%/yrLatest (2026): $1,134 · -1.4% YoY. Source: county tax records.
Cash-flow waterfall
monthlySold comps — $/sqft
last 12 mo · ≤1 miLoading sold comps…