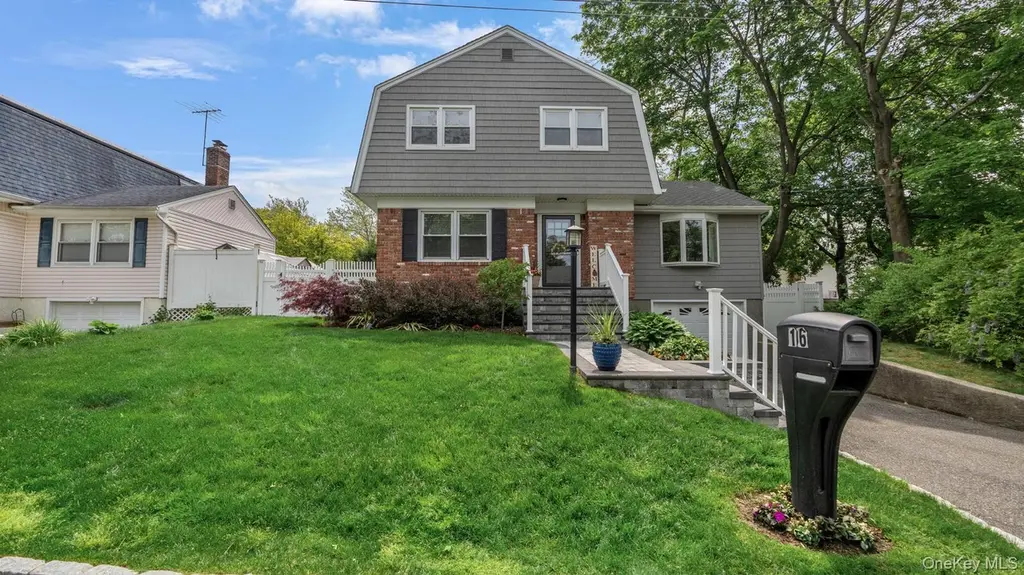
16 Kingsley Rd
West Hills, NY 11743
$849,999D
4 bd · 2.5 ba ·
2,400 sqft ·
Built 1971
· SingleFamily
· Active
· 31 DOM
Cashflow @ list (25.0% down · 7.5%)
Estimated rent
$5,950/mo
Mortgage (P&I)
−$4,457
Tax + insurance
−$1,378
HOA
−$0
Vac / Maint / Mgmt
−$1,250
Net cashflow
$-1,135/mo
Annual
$-13,617/yr
Cap rate
4.69%
Cash-on-cash
-5.72%
DSCR
0.75
1% rule
0.70%
Cash to close
$238,000
Investor read
- This is a 4-bed/2.5-bath single-family listed at $850k.
- At list price, monthly cash flow is $-1k ($-14k/yr) — negative.
- To cash-flow at today's rent, offer at most $650k (23.6% below list).
- To meet the 1% rule (rent ≥ 1% of price), the offer needs to be $595k (30.0% below list).
- It's been on market 31 days — a 3% lower offer ($824k) is reasonable based on typical stale-listing flexibility.
- Recommended offer: $595k (30.0% below list) — sets the bar for 1% rule.
- Local home prices are declining (-3.0%/yr); year-one equity from $6k of loan paydown is wiped out by about $26k of value loss. Plan a longer hold.
- Location reads 68/100 on livability (#519 in NY) — a middle-class / working-renter tenant base. Strengths: crime A+, commute A+, employment A+; Watch: amenities F, cost of living F, health & safety F.
- South Huntington Union Free School District (suburban): math 48% / reading 55% proficiency, ranked #290 of 590 in NY (top 49%) — acceptable for families but not a draw, mixed tenant base, ~2y average lease.
- Market conditions: Rents rising fast (+6.1%/yr); 261 active listings in the ZIP; 2 comparable units currently listed for rent nearby; high-income renter base; 1,366 units permitted in Suffolk County in 2024 (216 in 5+ unit buildings).
- Suffolk County population projected to shrink 5% by 2050 — rents likely to lag national; underwrite the cash flow, not the appreciation.
- Current owner paid $520k; list at $850k implies a 63% gain — meaningful room to come down on a strong offer.
- Climate carrying-cost: major wind risk, 72% chance of damaging wind over 30y; extreme-heat days projected 7→16/yr by 2055 (HVAC capex compounding) — expect insurance premiums to compound above CPI over the hold.
- This rent runs 39% of the median local income ($183k/yr) — at the standard rent-burdened threshold; future hikes will face affordability resistance.
Questions for listing agent
- What do current leases actually rent for vs. the listed asking? Can we see a recent rent roll and the last 12 months of T-12 income?
- It's been on market 31 days. Have you received any prior offers? Is the seller open to a 30% concession, seller financing, or rate buy-down credit?
- Built in 1971 — when were the roof, HVAC, electrical panel, plumbing, and water heater last replaced?
- Is there a deadline driving the sale (1031 exchange, divorce, estate, relocation)? That informs how much negotiation room exists.
- The area grade is low — what's the realistic commute time and amenity access for the typical tenant pool here? Any planned neighborhood developments (good or bad) we should know about?
- What's the average days-on-market for RENTAL listings here right now (not sales)? A rising rental-DOM trend means longer vacancies and softer asking-rent achievability than the comps imply.
- What's the recent tenant-quality profile in this submarket — average credit score on applications, eviction rate, late-payment / NSF rate, and stable-employment percentage? A property-management company in the area should have these aggregated.
- How much new for-sale + rental construction is in the pipeline within 1–3 miles? Heavy new supply typically softens prices + rents 12–24 months out; constrained supply supports both.
CashFlowRE · CFR-R211K0D059SFB8
· Data 5 days ago
cashflowre.app · 2026-05-29