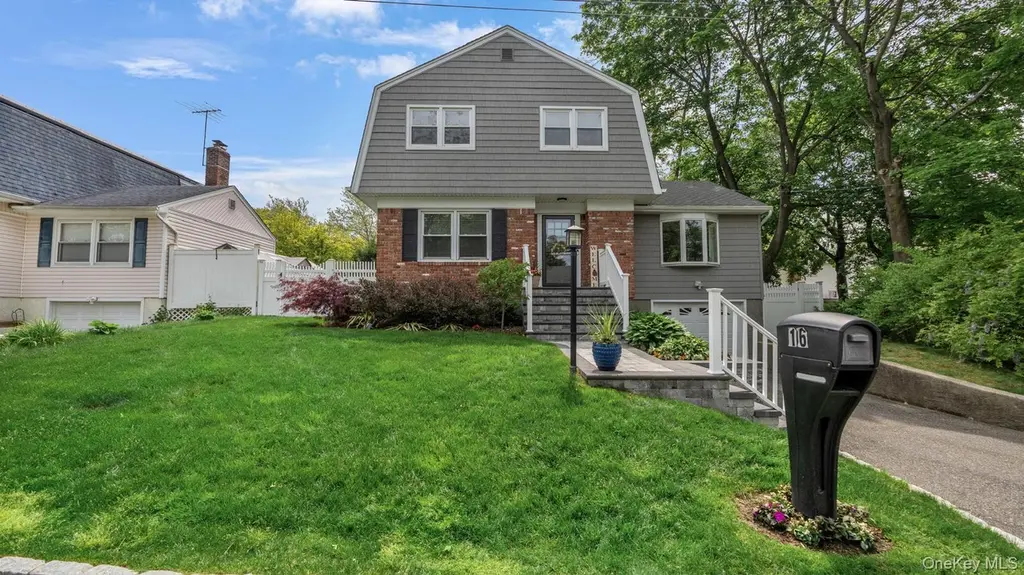
16 Kingsley Rd · West Hills, NY
Flood risk 1/10 · Minimal
- FEMA flood zone
- X (unshaded)
- Chance of flooding over 30 yrs
- 0.0%
- Est. flood insurance / yr
- $473 – $860
Fire risk 3/10 · Minor
- Est. fire insurance / yr
- $691 – $1,283
Heat risk 5/10 · Moderate
- Hot days now (above 97°F)
- 7 days/yr
- Hot days in 30 yrs
- 16 days/yr
Wind risk 6/10 · Moderate
- Chance of severe wind over 30 yrs
- 72.0%
Air-quality risk 4/10 · Minor
- Unhealthy air days now
- 4 days/yr
- Unhealthy air days in 30 yrs
- 5 days/yr
Risk factors via First Street. Map © Google.
Why this score? — see what drove the D grade
The composite is a weighted blend of 9 inputs, each scored 0–100. Each bar is that input's sub-score; the figure is the points it added to the 100-point composite (weight × sub-score).
- ARV discount +15.0/15.0
- Cash flow +7.3/30.0
- Schools +4.8/10.0
- Rent growth +4.0/5.0
- Livability +3.4/5.0
- Condition / age +2.5/5.0
- 1% rule +2.0/10.0
- DSCR +1.5/10.0
- Appreciation +0.0/10.0
$849,999
🖨 Deal sheet 📄 Offer letter ✓ Due diligence
Listing remarks
Welcome to a home that truly delivers the move-in ready lifestyle today’s buyers are hoping to find. Thoughtfully updated and meticulously maintained, this Huntington residence blends timeless comfort with modern upgrades, creating a space that feels both stylish and functional from the moment you arrive. Inside, hardwood floors flow throughout the home, while the updated eat-in kitchen features quartz countertops, quality cabinetry, double ovens, and a layout designed for both everyday living and effortless entertaining. The home’s warm and inviting interior offers comfortable living space across every level, including a finished basement ideal for a media room, home office, gy
Key facts
- Finished basement
- 6,098 sq ft lot
- Garage
Tags
Property features AI
Exterior
- Parking: Attached parking; 1-car garage; No carport
- Utilities: Cesspool sewer; Public trash collection
- Home design: Single family residence; Living area per plans
- Exterior features: Cedar exterior; Back yard fencing; Not waterfront
Interior
- Kitchen: Oven; Refrigerator
- Bathrooms: Two full bathrooms; One half bathroom
- Heating & cooling: Central air conditioning; Electric heating; Oil heating
- Interior features: Eat-in kitchen; Formal dining room; Finished full basement; Pull-down attic stairs; One fireplace
Neighborhood map
What this means for you Summary
Snapshot
- This is a 4-bed/2.5-bath single-family listed at $850k.
Deal economics
- At list price, monthly cash flow is $-1k ($-14k/yr) — negative.
- To cash-flow at today's rent, offer at most $650k (23.6% below list).
- To meet the 1% rule (rent ≥ 1% of price), the offer needs to be $595k (30.0% below list).
- Recommended offer: $595k (30.0% below list) — sets the bar for 1% rule.
Location & tenants
- Location reads 68/100 on livability (#519 in NY) — a middle-class / working-renter tenant base. Strengths: crime A+, commute A+, employment A+; Watch: amenities F, cost of living F, health & safety F.
- South Huntington Union Free School District (suburban): math 48% / reading 55% proficiency, ranked #290 of 590 in NY (top 49%) — acceptable for families but not a draw, mixed tenant base, ~2y average lease.
- Market conditions: Rents rising fast (+6.1%/yr); 261 active listings in the ZIP; 2 comparable units currently listed for rent nearby; high-income renter base; 1,366 units permitted in Suffolk County in 2024 (216 in 5+ unit buildings).
- This rent runs 39% of the median local income ($183k/yr) — at the standard rent-burdened threshold; future hikes will face affordability resistance.
Forward outlook
- Local home prices are declining (-3.0%/yr); year-one equity from $6k of loan paydown is wiped out by about $26k of value loss. Plan a longer hold.
- Suffolk County population projected to shrink 5% by 2050 — rents likely to lag national; underwrite the cash flow, not the appreciation.
Negotiation context
- It's been on market 31 days — a 3% lower offer ($824k) is reasonable based on typical stale-listing flexibility.
- Current owner paid $520k; list at $850k implies a 63% gain — meaningful room to come down on a strong offer.
Risks & watch-outs
- Climate carrying-cost: major wind risk, 72% chance of damaging wind over 30y; extreme-heat days projected 7→16/yr by 2055 (HVAC capex compounding) — expect insurance premiums to compound above CPI over the hold.
Questions for the listing agent
- What do current leases actually rent for vs. the listed asking? Can we see a recent rent roll and the last 12 months of T-12 income?
- It's been on market 31 days. Have you received any prior offers? Is the seller open to a 30% concession, seller financing, or rate buy-down credit?
- Built in 1971 — when were the roof, HVAC, electrical panel, plumbing, and water heater last replaced?
- Is there a deadline driving the sale (1031 exchange, divorce, estate, relocation)? That informs how much negotiation room exists.
- The area grade is low — what's the realistic commute time and amenity access for the typical tenant pool here? Any planned neighborhood developments (good or bad) we should know about?
- What's the average days-on-market for RENTAL listings here right now (not sales)? A rising rental-DOM trend means longer vacancies and softer asking-rent achievability than the comps imply.
- What's the recent tenant-quality profile in this submarket — average credit score on applications, eviction rate, late-payment / NSF rate, and stable-employment percentage? A property-management company in the area should have these aggregated.
- How much new for-sale + rental construction is in the pipeline within 1–3 miles? Heavy new supply typically softens prices + rents 12–24 months out; constrained supply supports both.
Investment metrics
- 1% rule
- 0.70% ✗
- Cap rate
- 4.69%
- Cash-on-cash
- -5.72%
- DSCR
- 0.75
- GRM
- 11.9
CMA / ARV
- ARV (median comp)
- $1,024,858
- List price
- $849,999
- Delta
- -17.06%
- Verdict
- UNDERPRICED
- Comps
- 20 within 1.0 mi
Show comp detail 7 sales within ~0.75 mi
| Address | Dist | Beds/Ba | Sqft | Sold | Price | $/sf | Match |
|---|---|---|---|---|---|---|---|
| 14 Christa Ct | 0.16mi | 4/2.5 | 2,385 (-1%) | 1mo | $858,500 | $360 | 90 |
| 1 Oakleaf Ct | 0.38mi | 4/2.5 | 2,350 (-2%) | 4mo | $1,150,000 | $489 | 75 |
| 2 Brush Pl | 0.14mi | 4/2.5 | 2,100 (-12%) | 7mo | $935,000 | $445 | 66 |
| 5 Robin Ln | 0.32mi | 3/2.5 (-1) | 2,080 (-13%) | 5mo | $1,175,000 | $565 | 54 |
| 4 Club Ct | 0.46mi | 5/2.5 (+1) | 2,676 (+12%) | 5mo | $1,220,000 | $456 | 50 |
| 25A Hartman Hill Rd | 0.28mi | 3/3.0 (-1) | 2,200 (-8%) | 21mo | $900,000 | $409 | 48 |
| 31 Artisan Ave | 0.56mi | 3/4.0 (-1) | 2,548 (+6%) | 12mo | $1,335,000 | $524 | 43 |
Match score weights: distance 35% · size 25% · config 20% · recency 20%. Top-matched comps best support the ARV.
Projected returns pro-forma
-3.0% appreciation · 6.14% rent growth · sell at horizon
- IRR
- -22.7%
- Equity multiple
- 0.20×
- Total profit
- $-190,556
- Equity at exit
- $126,738
- IRR
- -10.7%
- Equity multiple
- 0.27×
- Total profit
- $-173,858
- Equity at exit
- $73,492
Cash invested: $238,000 (down + closing). Projections, not guarantees.
Landlord ↔ Tenant lean methodology
- Overall (STATE)
- 15 Strongly Tenant-Friendly
- State New York
- 15 Strongly Tenant-Friendly · D+10
- County
- — inherits STATE
- City
- — inherits STATE
ZIP-level market 11743
- Rents YoY
- 6.1%
- Active inventory
- 261
- Price-to-rent
- 11.9×
Monthly cashflow live
- Estimated rent
- $5,950 medium interval (Pro) →
- Mortgage (P&I)
- −$4,457
- Tax from tax record
- −$1,024 /mo · $12,286/yr
- Insurance
- −$354
- HOA
- −$0
- Vacancy / Maint / Mgmt
- −$1,250
- Net cashflow
- $-1,135
Break-even live
UW: 25.0% down · 7.5% · 30yr · 1.5% tax · 5.0% vac · 8.0% maint · 8.0% mgmt
Financing live
Cash to close
- Down payment
- $212,500
- Closing costs
- $25,500
- Reserves months
- —
- Total cash needed
- —
Loan-product check · same deal, 3 products live
Conventional
25% down · 7.5% · 30yr
- Down + closing
- —
- Monthly P&I
- —
- Monthly cashflow
- —
- DSCR
- —
- Eligible?
- —
Personal DTI + credit; lowest rate.
DSCR
20% down · 8.5% · 30yr
- Down + closing
- —
- Monthly P&I
- —
- Monthly cashflow
- —
- DSCR
- —
- Eligible?
- —
No personal income docs; deal must DSCR.
Hard money
10% down · 12.0% · 12mo
- Down + closing
- —
- Monthly P&I
- —
- Monthly cashflow
- —
- DSCR
- —
- Eligible?
- —
Short-term bridge; refi at stabilization.
Rent comps 2 comps
| Address | Beds | Baths | Sqft | Rent | $/sqft | DOM | Units | Dist |
|---|---|---|---|---|---|---|---|---|
| 13A Homeland Dr Huntington, NY | 3.0 | 2.0 | 1600 | $4,400 | $2.75 | 1d | 1 | 0.36mi |
| 240 Plainview Rd Woodbury, NY | 5.0 | 3.0 | 2650 | $12,000 | $4.53 | 1d | 1 | 1.08mi |
Listing history 14 events
-
2026-06-15days on market $849,999 Active 31 DOM
-
2026-06-13days on market $849,999 Active 29 DOM
-
2026-06-09days on market $849,999 Active 25 DOM
-
2026-06-08days on market $849,999 Active 24 DOM
-
2026-06-07days on market $849,999 Active 23 DOM
-
2026-06-04days on market $849,999 Active 20 DOM
-
2026-06-03days on market $849,999 Active 19 DOM
-
2026-06-02days on market $849,999 Active 18 DOM
-
2026-06-01days on market $849,999 Active 17 DOM
-
2026-05-31days on market $849,999 Active 16 DOM
-
2026-05-15$849,999 Active 1074-char remark
-
2021-03-05soldstatus $520,000
-
2020-05-28soldstatus $353,000
-
2007-08-08soldstatus $449,000
ⓘ Source: listings_history table (triggers on properties + properties_extension) + one-shot
backfill from property_details.listing_events for pre-trigger history.
Tax reassessment forecast NY · Partial reset (capped growth)
- Current annual tax
- $12,286 · $1,024/mo
- Projected year-2 tax
- $13,326 · $1,110/mo
- Expected delta
- +$1,039/yr (+$87/mo · 8.5%)
ⓘ Screening estimate from a state-policy table — verify with the county assessor before closing.
Climate risk First Street
- Flood 1/10 Low FEMA zone X (unshaded) · 0% chance over 30 yrs
- Wildfire 3/10 Moderate
- Heat 5/10 Major 7 d/yr ≥97°F today · 16 d/yr by 30 yrs out
- Wind 6/10 Major 72% chance of damaging wind over 30 yrs
- Air quality 4/10 Moderate 4 unhealthy d/yr today · 5 by 30 yrs out
Nearby sold comps map
Loading sold comps map…
Walkable amenities ~0.75 mi
Loading nearby amenities…
Taxation est. · year 1
- Rental income
- $71,403
- − Mortgage interest
- −$47,613
- − Property taxes
- −$12,286
- − Insurance
- −$4,250
- − Repairs & maintenance
- −$5,712
- − Management
- −$5,712
- − Depreciation
- −$24,727
- Taxable loss
- −$28,898
- Est. tax savings @ 24.0%
- +$6,935
- After-tax cash flow
- $-6,682/yr
For passive investors: Depreciation is non-cash, so a rental often shows a tax loss while cash-flowing — sheltering income. Rental losses are passive: they offset passive income freely, and up to $25,000/yr can offset ordinary (W-2) income if you actively participate and your MAGI is under $100k (phasing out to $0 by $150k); unused losses carry forward. On sale, claimed depreciation is recaptured at up to 25%, and gains may owe capital-gains tax (a 1031 exchange can defer both). Figures are a year-1 estimate at your 24.0% rate — not tax advice; consult a CPA.
Schools (NCES district)
- District
- South Huntington Union Free School District
- NCES district ID
- 3627300
- Math proficiency
- 48% ▼ -9.00%
- Reading proficiency
- 55% ▲ 3.00%
- Median HH income
- $92,630
- Composite
- 48.08/100
- National rank
- #2189
- State rank
- #290 of 590 in NY
Livability — West Hills
- Score
- 68/100
- State rank
- #519
- US rank
- #9213
Category grades
Schools grade is shown separately in the Schools card above.
Census & demographics
- Census place
- West Hills, NY
- County
- Suffolk County · 679,920 people
- Metro
- New York-Newark-Jersey City, NY-NJ-PA
- Population (ZIP)
- 43,490
- Household income
- $183,187
- Rent vs Own
- Severe rent burden
- 479.0
Population outlook (Suffolk County) Hauer SSP2
- Today (2025)
- 1,505,262 people
- By 2030
- 1,498,318 · -0.5%
- By 2040
- 1,471,101 · -2.3%
- By 2050
- 1,424,848 · -5.3%
- By 2075
- 1,337,157 · -11.2%
- By 2100
- 1,217,720 · -19.1%
Race, ethnicity, and origin ACS 2023
- Neighborhood character
- Predominantly White (75%)
- Race & ethnicity
- White 75% Hispanic / Latino 12% Two or more races 10% Asian 5% Black 4%
- Hispanic origin (detail)
- Puerto Rican 4%
- Common ancestry
- Romanian 6% Scotch-Irish 3% Slovak 2%
- Foreign-born
- 11% · Canada, China, Jamaica
- Languages at home
- 83% English-only · Spanish 9% Other Indo-European 3% Chinese 1%
Political lean MEDSL · Suffolk
- 2024 margin
- Lean R (+10.0) · D 45.0% · R 55.0%
- 2008→2024 swing
- -16.0pp toward R · 2008: 6.0pp · 2024: -10.0pp
- All cycles
- 2024: R+10.0 2020: R+0.0 2016: R+8.2 2012: D+2.9 2008: D+6.0
Not yet ingested
- Civics
- —
Market trends
- HPI YoY
- ▼ -659.59%
- Current HPI
- 279.0693
- Rent YoY
- ▲ 6.14%
- Metro
- New York-Newark-Jersey City, NY-NJ-PA
- State GDP YoY
- ▲ 2.60%
- F500 in state
- 92
Industry mix (Fortune 500 HQ in NY)
| Industry | F500 HQs | Revenue |
|---|---|---|
| Financial Services | 10 | $950B |
|
||
| Consumer Goods | 9 | $162B |
|
||
| Insurance | 4 | $225B |
|
||
| Telecommunications | 2 | $144B |
|
||
| Pharmaceuticals | 2 | $112B |
|
||
| Media / Entertainment | 2 | $69B |
|
||
Price history
+89.3% since first listed4 events — show timeline
- 2026-05-15 Listed $849,999 OneKey® MLS as Distributed by MLS Grid
- 2021-03-05 Sold (Public Records) $520,000 Public Records
- 2020-05-28 Sold (Public Records) $353,000 Public Records
- 2007-08-08 Sold (Public Records) $449,000 Public Records
Property tax history
+2.6%/yrLatest (2025): $12,286 · +0.0% YoY. Source: county tax records.
Cash-flow waterfall
monthlySold comps — $/sqft
last 12 mo · ≤1 miLoading sold comps…