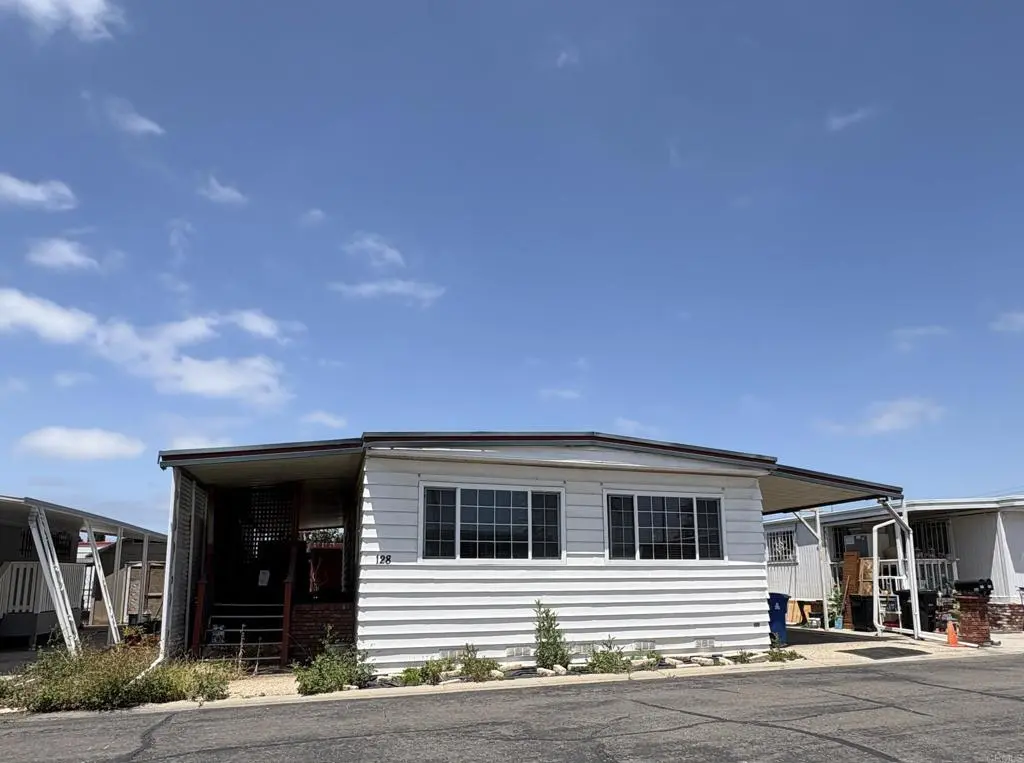
521 Orange Ave #128
Chula Vista, CA 91911
$55,000D
2 bd · 2.0 ba ·
1,080 sqft ·
Built 1970
· Manufactured
· Active
· 27 DOM
Cashflow @ list (25.0% down · 7.5%)
Estimated rent
$2,775/mo
Mortgage (P&I)
−$288
Tax + insurance
−$219
HOA
−$105
Vac / Maint / Mgmt
−$583
Net cashflow
$1,580/mo
Annual
$18,957/yr
Cap rate
40.76%
Cash-on-cash
123.10%
DSCR
6.48
1% rule
5.05%
Cash to close
$15,400
Investor read
- This is a 2-bed/2.0-bath manufactured listed at $55k.
- At list price, monthly cash flow is $2k ($19k/yr) — positive.
- The deal already cash-flows at list — no discount required.
- Meets the 1% rule at list price ($3k rent vs $55k).
- It's been on market 27 days — a 2% lower offer ($54k) is reasonable based on typical stale-listing flexibility.
- Recommended offer: $54k (1.5% below list) — sets the bar for market timing.
- Local home prices are declining (-3.0%/yr); year-one equity from $380 of loan paydown is wiped out by about $2k of value loss. Plan a longer hold.
- Location reads 75/100 on livability (#127 in CA, #4,345 nationally) — a middle-class / working-renter tenant base. Strengths: amenities A+, commute A+, employment A+; Watch: health & safety C-, cost of living F.
- Sweetwater Union High (suburban): math 36% / reading 52% proficiency, ranked #187 of 517 in CA (top 36%) — families likely to look elsewhere, expect single-tenant / working-renter base with shorter leases.
- Watch-outs: property tax is 4.3% of price.
- Market conditions: Rents soft (-2.6%/yr); 159 active listings in the ZIP; 36 comparable units currently listed for rent nearby; rentals leasing fast (median 2d on market — plan ~1-2 weeks tenant-placement turnaround); solid renter incomes; 11,759 units permitted in San Diego County in 2024 (7,244 in 5+ unit buildings).
- San Diego County population projected at +20% by 2050 — long-run rental-demand tailwind backs the buy-and-hold thesis.
- 3 sale attempts since 4y ago with the ask held roughly flat each time — persistent listings suggest the price (not the market) is what's stuck; bring a comps-based counter.
- At projected returns (-3.0% appreciation + 0.0% rent growth), your $15k cash investment doubles in ~1 year — after that, you're playing with house money.
- Cap rate 40.8% vs local median 2.7% in Chula Vista — top-decile yield for the area; either an underpriced asset or a hidden risk that comps aren't pricing in. Stress-test before assuming the spread holds.
- This rent runs 40% of the median local income ($82k/yr) — at the standard rent-burdened threshold; future hikes will face affordability resistance.
Questions for listing agent
- Built in 1970 — when were the roof, HVAC, electrical panel, plumbing, and water heater last replaced?
- Property tax is high relative to price — has the assessment been appealed recently, and will the sale trigger a re-assessment?
- What does the HOA fee cover, when was the last increase, and are there any pending special assessments or reserve-fund shortfalls?
- Is there a deadline driving the sale (1031 exchange, divorce, estate, relocation)? That informs how much negotiation room exists.
- Schools are B-rated — typically a magnet for longer-tenancy family renters. What's the average tenant stay here, and is there a school-zone premium baked into asking?
- The area grade is low — what's the realistic commute time and amenity access for the typical tenant pool here? Any planned neighborhood developments (good or bad) we should know about?
- What's the average days-on-market for RENTAL listings here right now (not sales)? A rising rental-DOM trend means longer vacancies and softer asking-rent achievability than the comps imply.
- What's the recent tenant-quality profile in this submarket — average credit score on applications, eviction rate, late-payment / NSF rate, and stable-employment percentage? A property-management company in the area should have these aggregated.
CashFlowRE · CFR-R3PWRTDJEWXRYV
· Data 2 days ago
cashflowre.app · 2026-05-29