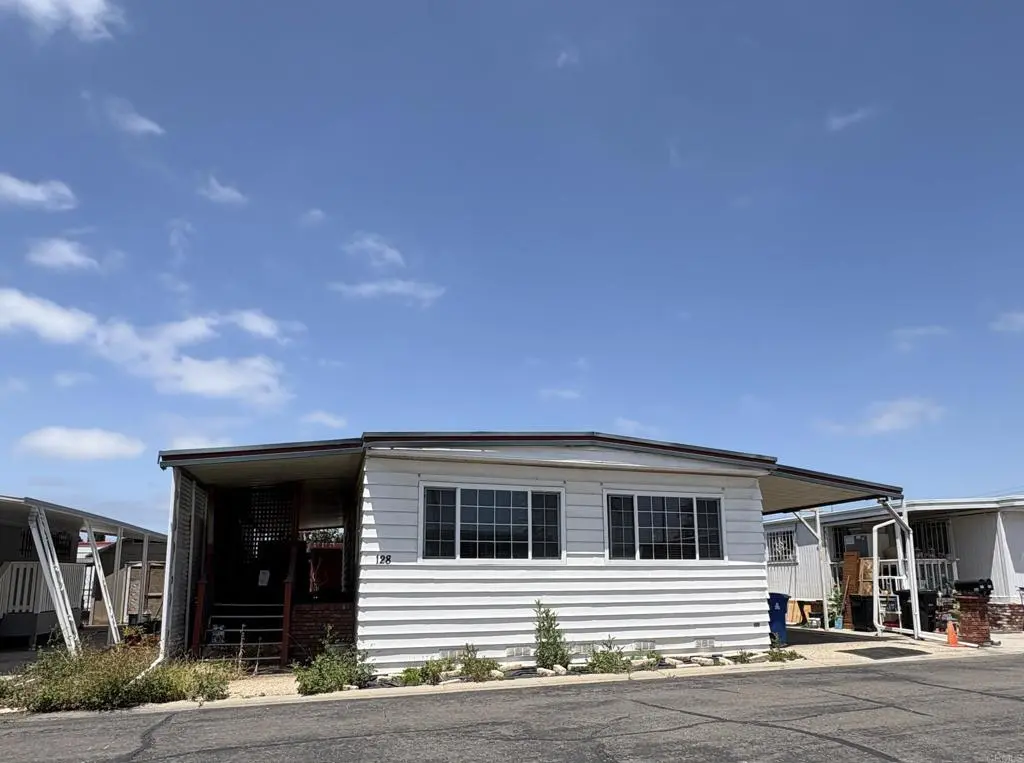
521 Orange Ave #128 · Chula Vista, CA
Flood risk 1/10 · Minimal
- FEMA flood zone
- X (unshaded)
- Chance of flooding over 30 yrs
- 0.0%
- Est. flood insurance / yr
- $507 – $1,088
Fire risk 1/10 · Minimal
- Est. fire insurance / yr
- $659 – $1,223
Heat risk 4/10 · Minor
- Hot days now (above 86°F)
- 6 days/yr
- Hot days in 30 yrs
- 15 days/yr
Wind risk 1/10 · Minimal
- Chance of severe wind over 30 yrs
- —
Air-quality risk 1/10 · Minimal
- Unhealthy air days now
- 0 days/yr
- Unhealthy air days in 30 yrs
- 0 days/yr
Risk factors via First Street. Map © Google.
Why this score? — see what drove the D grade
The composite is a weighted blend of 9 inputs, each scored 0–100. Each bar is that input's sub-score; the figure is the points it added to the 100-point composite (weight × sub-score).
- Cash flow +15.0/30.0
- ARV discount +7.5/15.0
- 1% rule +5.0/10.0
- DSCR +5.0/10.0
- Schools +3.9/10.0
- Livability +3.8/5.0
- Condition / age +2.5/5.0
- Rent growth +1.9/5.0
- Appreciation +0.0/10.0
$55,000
🖨 Deal sheet 📄 Offer letter ✓ Due diligence
Listing remarks
SENIOR COMMUNITY ~ $105 Monthly HOA. THE VALUE IS ON THE LAND. $55,000 is for the home only. You must purchase the land and the home together (2 separate transactions for a total of $299,900 price). 2 bed, 2 bath, 1080sf. This is the perfect spot to replace the existing home with a BRAND NEW manufactured home. This home will be sold as a fixer upper and as is. Laminate flooring, large living room with large windows to let the sunlight in. Dining room right off the kitchen. Kitchen with wood cabinets and granite counter tops; stove top, oven, dishwasher and refrigerator are included with sale. There is a walk-in tub in guest bathroom. Full size shower in main bathroom. Walk-in closets in bot
Key facts
- Gated community
- Laminate flooring
- Clubhouse
Tags
Property features AI
Finance
- Other: Lot described as 0–1 unit per acre (estimated); No common walls with neighboring homes; Zoned R-1 (single family residential)
- HOA & community: Part of Orange Tree association; Monthly association fee of $105; Association amenities include pool and clubhouse; Community of approximately 153 units; Senior community
Exterior
- Parking: Carport parking (2 spaces)
- Utilities: Private water
- Home design: Manufactured house; Single-story; Condominium community; Entry level is 1
- Construction: Metal roof; Pier jacks foundation; Noted as fixer condition
- Exterior features: Covered patio; Community pool; Shed on property
Interior
- Kitchen: Refrigerator; Gas range; Dishwasher
- Bedrooms: Bedrooms all on the ground floor
- Flooring: Carpet; Laminate
- Bathrooms: 2 full bathrooms
- Heating & cooling: Forced air heating
- Interior features: One-level layout; Entry through the kitchen; All bedrooms located on the main level
- Laundry & utility: No laundry hook-ups or in-unit laundry listed
Neighborhood map
What this means for you Summary
Snapshot
- This is a 2-bed/2.0-bath manufactured listed at $55k.
Deal economics
- At list price, monthly cash flow is $2k ($19k/yr) — positive.
- The deal already cash-flows at list — no discount required.
- Meets the 1% rule at list price ($3k rent vs $55k).
- Recommended offer: $54k (1.5% below list) — sets the bar for market timing.
- Cap rate 40.8% vs local median 2.7% in Chula Vista — top-decile yield for the area; either an underpriced asset or a hidden risk that comps aren't pricing in. Stress-test before assuming the spread holds.
Location & tenants
- Location reads 75/100 on livability (#127 in CA, #4,345 nationally) — a middle-class / working-renter tenant base. Strengths: amenities A+, commute A+, employment A+; Watch: health & safety C-, cost of living F.
- Sweetwater Union High (suburban): math 36% / reading 52% proficiency, ranked #187 of 517 in CA (top 36%) — families likely to look elsewhere, expect single-tenant / working-renter base with shorter leases.
- Market conditions: Rents soft (-2.6%/yr); 159 active listings in the ZIP; 36 comparable units currently listed for rent nearby; rentals leasing fast (median 2d on market — plan ~1-2 weeks tenant-placement turnaround); solid renter incomes; 11,759 units permitted in San Diego County in 2024 (7,244 in 5+ unit buildings).
- This rent runs 40% of the median local income ($82k/yr) — at the standard rent-burdened threshold; future hikes will face affordability resistance.
Forward outlook
- Local home prices are declining (-3.0%/yr); year-one equity from $380 of loan paydown is wiped out by about $2k of value loss. Plan a longer hold.
- San Diego County population projected at +20% by 2050 — long-run rental-demand tailwind backs the buy-and-hold thesis.
- At projected returns (-3.0% appreciation + 0.0% rent growth), your $15k cash investment doubles in ~1 year — after that, you're playing with house money.
Negotiation context
- It's been on market 27 days — a 2% lower offer ($54k) is reasonable based on typical stale-listing flexibility.
- 3 sale attempts since 4y ago with the ask held roughly flat each time — persistent listings suggest the price (not the market) is what's stuck; bring a comps-based counter.
Risks & watch-outs
- Watch-outs: property tax is 4.3% of price.
Questions for the listing agent
- Built in 1970 — when were the roof, HVAC, electrical panel, plumbing, and water heater last replaced?
- Property tax is high relative to price — has the assessment been appealed recently, and will the sale trigger a re-assessment?
- What does the HOA fee cover, when was the last increase, and are there any pending special assessments or reserve-fund shortfalls?
- Is there a deadline driving the sale (1031 exchange, divorce, estate, relocation)? That informs how much negotiation room exists.
- Schools are B-rated — typically a magnet for longer-tenancy family renters. What's the average tenant stay here, and is there a school-zone premium baked into asking?
- The area grade is low — what's the realistic commute time and amenity access for the typical tenant pool here? Any planned neighborhood developments (good or bad) we should know about?
- What's the average days-on-market for RENTAL listings here right now (not sales)? A rising rental-DOM trend means longer vacancies and softer asking-rent achievability than the comps imply.
- What's the recent tenant-quality profile in this submarket — average credit score on applications, eviction rate, late-payment / NSF rate, and stable-employment percentage? A property-management company in the area should have these aggregated.
- How much new for-sale + rental construction is in the pipeline within 1–3 miles? Heavy new supply typically softens prices + rents 12–24 months out; constrained supply supports both.
Investment metrics
- 1% rule
- 5.05% ✓
- Cap rate
- 40.76%
- Cash-on-cash
- 123.10%
- DSCR
- 6.48
- GRM
- 1.7
CMA / ARV
- ARV (on-the-fly)
- $196,560
- Comps found
- 12
Show comp detail 12 sales within ~0.75 mi
| Address | Dist | Beds/Ba | Sqft | Sold | Price | $/sf | Match |
|---|---|---|---|---|---|---|---|
| 521 Orange Ave #34 | 0.15mi | 2/2.0 | 1,080 (0%) | 2mo | $405,000 | $375 | 91 |
| 521 Orange Ave #150 | 0.00mi | 2/2.0 | 1,046 (-3%) | 9mo | $430,000 | $411 | 88 |
| 521 Orange Ave #152 | 0.00mi | 2/2.0 | 1,120 (+4%) | 14mo | $399,000 | $356 | 82 |
| 501 Anita St. Spc 16 | 0.27mi | 2/2.0 | 1,101 (+2%) | 6mo | $200,000 | $182 | 80 |
| 501 Anita #73 | 0.20mi | 2/2.0 | 1,040 (-4%) | 14mo | $150,000 | $144 | 73 |
| 600 Anita St #68 | 0.23mi | 2/2.0 | 1,176 (+9%) | 3mo | $260,000 | $221 | 72 |
| 501 Anita Spc 21 | 0.20mi | 2/2.0 | 1,153 (+7%) | 9mo | $210,000 | $182 | 72 |
| 444 Anita St #55 | 0.32mi | 2/2.0 | 1,022 (-5%) | 11mo | $153,000 | $150 | 67 |
| 368 Anita St Spc 96 | 0.46mi | 2/2.0 | 1,100 (+2%) | 19mo | $125,000 | $114 | 59 |
| 501 Anita St #176 | 0.20mi | 2/2.0 | 960 (-11%) | 16mo | $150,000 | $156 | 59 |
| 1500 3rd Ave #76 | 0.53mi | 3/2.0 (+1) | 1,200 (+11%) | 11mo | $185,000 | $154 | 42 |
| 1500 Third Ave #88 | 0.53mi | 3/2.0 (+1) | 1,198 (+11%) | 14mo | $249,900 | $209 | 41 |
Match score weights: distance 35% · size 25% · config 20% · recency 20%. Top-matched comps best support the ARV.
Projected returns pro-forma
-3.0% appreciation · 0.0% rent growth · sell at horizon
- IRR
- —
- Equity multiple
- 6.44×
- Total profit
- $83,756
- Equity at exit
- $8,201
- IRR
- —
- Equity multiple
- 12.16×
- Total profit
- $171,815
- Equity at exit
- $4,755
Cash invested: $15,400 (down + closing). Projections, not guarantees.
Landlord ↔ Tenant lean methodology
- Overall (STATE)
- 18 Strongly Tenant-Friendly
- State California
- 18 Strongly Tenant-Friendly · D+13
- County
- — inherits STATE
- City
- — inherits STATE
ZIP-level market 91911
- Rents YoY
- -2.6%
- Active inventory
- 159
- Price-to-rent
- 1.7×
Monthly cashflow live
- Estimated rent
- $2,775 high interval (Pro) →
- Mortgage (P&I)
- −$288
- Tax from tax record
- −$196 /mo · $2,352/yr
- Insurance
- −$23
- HOA
- −$105
- Vacancy / Maint / Mgmt
- −$583
- Net cashflow
- $1,580
Break-even live
UW: 25.0% down · 7.5% · 30yr · 1.5% tax · 5.0% vac · 8.0% maint · 8.0% mgmt
Financing live
Cash to close
- Down payment
- $13,750
- Closing costs
- $1,650
- Reserves months
- —
- Total cash needed
- —
Loan-product check · same deal, 3 products live
Conventional
25% down · 7.5% · 30yr
- Down + closing
- —
- Monthly P&I
- —
- Monthly cashflow
- —
- DSCR
- —
- Eligible?
- —
Personal DTI + credit; lowest rate.
DSCR
20% down · 8.5% · 30yr
- Down + closing
- —
- Monthly P&I
- —
- Monthly cashflow
- —
- DSCR
- —
- Eligible?
- —
No personal income docs; deal must DSCR.
Hard money
10% down · 12.0% · 12mo
- Down + closing
- —
- Monthly P&I
- —
- Monthly cashflow
- —
- DSCR
- —
- Eligible?
- —
Short-term bridge; refi at stabilization.
Rent comps 36 comps
| Address | Beds | Baths | Sqft | Rent | $/sqft | DOM | Units | Dist |
|---|---|---|---|---|---|---|---|---|
| 1250 Fifth Ave Chula Vista, CA | 2.0–3.0 | 2.0 | 1045 | $2,500 | $2.39 | 1d | 4 | 0.42mi |
| 393 Montgomery St Unit 4 Chula Vista, CA | 2.0 | 1.0 | 757 | $2,095 | $2.77 | 10d | 1 | 0.44mi |
| 1225 Broadway Chula Vista, CA | 1.0–2.0 | 1.0–2.0 | 837 | $2,701 | $3.23 | 1d | 12 | 0.45mi |
| 1311 Fourth Ave Chula Vista, CA | 3.0 | 1.0–2.0 | 824 | $3,292 | $3.99 | 1d | 9 | 0.47mi |
| 307 Orange Ave Chula Vista, CA | 1.0–2.0 | 1.0–2.0 | 662 | $2,225 | $3.36 | 1d | 2 | 0.53mi |
| 1240 Fourth Ave Chula Vista, CA | 3.0 | 1.0 | 1000 | $4,588 | $4.59 | 2d | 1 | 0.56mi |
| 317 Tremont St Unit 5 Chula Vista, CA | 2.0 | 1.0 | 870 | $2,295 | $2.64 | 1d | 1 | 0.59mi |
| 495 Queen Anne Dr Unit 1 Chula Vista, CA | 2.0 | 1.0 | 1000 | $2,800 | $2.80 | 2d | 1 | 0.63mi |
| 240 Quintard St Chula Vista, CA | 1.0–2.0 | 1.0 | 662 | $2,400 | $3.62 | 1d | 4 | 0.79mi |
| 1145 Fourth Ave Chula Vista, CA | 1.0 | 1.0 | 700 | $1,945 | $2.78 | 1d | 1 | 0.79mi |
| 1105 Fourth Ave Chula Vista, CA | 1.0–2.0 | 1.0–2.0 | 848 | $2,775 | $3.27 | 1d | 1 | 0.86mi |
| 868 Elise St Unit B Chula Vista, CA | 3.0 | 1.0 | 909 | $2,400 | $2.64 | 1d | 1 | 0.88mi |
| 1051 Broadway Unit 49 Chula Vista, CA | 2.0 | 2.0 | 770 | $2,225 | $2.89 | 1d | 1 | 0.91mi |
| 1051 Broadway Unit 13 Chula Vista, CA | 2.0 | 2.0 | 875 | $2,325 | $2.66 | 1d | 1 | 0.91mi |
| 511 Wykes St Chula Vista, CA | 2.0 | 1.0 | 1000 | $2,650 | $2.65 | 2d | 1 | 0.97mi |
| 1067 Fourth Ave Chula Vista, CA | 2.0 | 1.0–2.0 | 702 | $2,855 | $4.06 | 1d | 1 | 0.98mi |
| 172 Palomar St Chula Vista, CA | 3.0 | 1.5 | 1152 | $3,400 | $2.95 | 10d | 1 | 0.99mi |
| 1038 Oaklawn Ave Chula Vista, CA | 3.0 | 1.5 | 1044 | $3,995 | $3.83 | 1d | 1 | 1.01mi |
| 615 Moss St Chula Vista, CA | 2.0 | 2.0 | 800 | $2,400 | $3.00 | 1d | 2 | 1.02mi |
| 1035 Fourth Ave Chula Vista, CA | 2.0 | 2.0 | 910 | $2,495 | $2.74 | 17d | 2 | 1.05mi |
| 574 Moss St Chula Vista, CA | 1.0–2.0 | 1.0 | 749 | $2,740 | $3.66 | 1d | 1 | 1.07mi |
| 986 Broadway Unit 982-314 Chula Vista, CA | 2.0 | 2.0 | 1044 | $3,295 | $3.16 | 7d | 1 | 1.08mi |
| 986 Broadway Unit 982-209 Chula Vista, CA | 1.0 | 1.0 | 725 | $2,595 | $3.58 | 17d | 1 | 1.08mi |
| 986 Broadway Unit 982-313 Chula Vista, CA | 2.0 | 2.0 | 1020 | $2,995 | $2.94 | 14d | 1 | 1.08mi |
| 986 Broadway Unit WAIT LIST 1x1 Chula Vista, CA | 1.0 | 1.0 | 725 | $2,595 | $3.58 | 1d | 1 | 1.08mi |
| 986 Broadway Unit 982-202 UNFURNISHED Chula Vista, CA | 2.0 | 2.0 | 1044 | $3,095 | $2.96 | 1d | 1 | 1.08mi |
| 986 Broadway Chula Vista, CA | 1.0 | 1.0 | 725 | $2,695 | $3.72 | 3d | 1 | 1.10mi |
| 986 Broadway Chula Vista, CA | 2.0 | 2.0 | 1020 | $3,295 | $3.23 | 4d | 1 | 1.10mi |
| 986 Broadway Chula Vista, CA | 2.0 | 2.0 | 1044 | $3,195 | $3.06 | 2d | 1 | 1.10mi |
| 652 Moss St Chula Vista, CA | 1.0–2.0 | 1.0–1.5 | 740 | $2,395 | $3.24 | 1d | 3 | 1.11mi |
| 128 Henry Ln Unit B Chula Vista, CA | 2.0 | 1.0 | 1000 | $2,100 | $2.10 | 1d | 1 | 1.15mi |
| 588 Arizona St Unit ARIZ-02 Chula Vista, CA | 2.0 | 2.0 | 850 | $2,375 | $2.79 | 1d | 1 | 1.16mi |
| 930 3rd Ave Chula Vista, CA | 2.0–3.0 | 2.0 | 1099 | $2,801 | $2.55 | 1d | 4 | 1.26mi |
| 768 Hollister St San Diego, CA | 2.0 | 2.0 | 840 | $2,300 | $2.74 | 1d | 1 | 1.33mi |
| 2055 Avenida Del Mexico Apt 208 San Diego, CA | 2.0 | 2.0 | 960 | $2,300 | $2.40 | 16d | 1 | 1.46mi |
| 2683 Caulfield Dr San Diego, CA | 3.0 | 2.0 | 1445 | $3,995 | $2.76 | 1d | 1 | 1.48mi |
HOA detail
- Monthly dues
- $105 · $1,260/yr
Listing history 21 events
-
2026-06-18days on market $55,000 Active 27 DOM
-
2026-06-17days on market $55,000 Active 26 DOM
-
2026-06-16days on market $55,000 Active 25 DOM
-
2026-06-15days on market $55,000 Active 24 DOM
-
2026-06-13days on market $55,000 Active 22 DOM
-
2026-06-13days on market $55,000 Active 21 DOM
-
2026-06-09days on market $55,000 Active 18 DOM
-
2026-06-08days on market $55,000 Active 17 DOM
-
2026-06-07days on market $55,000 Active 16 DOM
-
2026-06-04days on market $55,000 Active 13 DOM
-
2026-06-03days on market $55,000 Active 12 DOM
-
2026-06-02days on market $55,000 Active 11 DOM
-
2026-06-01days on market $55,000 Active 10 DOM
-
2026-05-31days on market $55,000 Active 9 DOM
-
2026-05-23$55,000 Active
-
2023-08-21historical
-
2023-05-18$299,999 Active
-
2022-12-26historical
-
2022-12-05$268,000 Active
-
2005-05-06soldstatus $169,000
-
1987-08-26soldstatus $27,000
ⓘ Source: listings_history table (triggers on properties + properties_extension) + one-shot
backfill from property_details.listing_events for pre-trigger history.
Tax reassessment forecast CA · Resets to sale price
- Current annual tax
- $2,352 · $196/mo
- Projected year-2 tax
- $2,352 · $196/mo
- Expected delta
- $0/yr ($0/mo · 0.0%)
ⓘ Screening estimate from a state-policy table — verify with the county assessor before closing.
Climate risk First Street
- Flood 1/10 Low FEMA zone X (unshaded) · 0% chance over 30 yrs
- Wildfire 1/10 Low
- Heat 4/10 Moderate 6 d/yr ≥86°F today · 15 d/yr by 30 yrs out
- Wind 1/10 Low
- Air quality 1/10 Low 0 unhealthy d/yr today · 0 by 30 yrs out
Nearby sold comps map
Loading sold comps map…
Walkable amenities ~0.75 mi
Loading nearby amenities…
Taxation est. · year 1
- Rental income
- $33,297
- − Mortgage interest
- −$3,081
- − Property taxes
- −$2,352
- − Insurance
- −$275
- − Repairs & maintenance
- −$2,664
- − Management
- −$2,664
- − HOA
- −$1,260
- − Depreciation
- −$1,600
- Taxable income
- $19,402
- Est. tax owed @ 24.0%
- −$4,657
- After-tax cash flow
- $14,301/yr
For passive investors: Depreciation is non-cash, so a rental often shows a tax loss while cash-flowing — sheltering income. Rental losses are passive: they offset passive income freely, and up to $25,000/yr can offset ordinary (W-2) income if you actively participate and your MAGI is under $100k (phasing out to $0 by $150k); unused losses carry forward. On sale, claimed depreciation is recaptured at up to 25%, and gains may owe capital-gains tax (a 1031 exchange can defer both). Figures are a year-1 estimate at your 24.0% rate — not tax advice; consult a CPA.
Schools (NCES district)
- District
- Sweetwater Union High
- NCES district ID
- 0638640
- Math proficiency
- 36% ▲ 3.00%
- Reading proficiency
- 52% ▼ -2.00%
- Median HH income
- $59,051
- Composite
- 38.61/100
- National rank
- #4158
- State rank
- #187 of 517 in CA
Livability — Chula Vista
- Score
- 75/100
- State rank
- #127
- US rank
- #4345
Category grades
Schools grade is shown separately in the Schools card above.
Census & demographics
- Census place
- Chula Vista, CA
- County
- San Diego County · 3,178,799 people
- City population
- 255,708
- Metro
- San Diego-Chula Vista-Carlsbad, CA
- Population (ZIP)
- 85,542
- Household income
- $82,350
- Rent vs Own
- Severe rent burden
- 3751.0
Population outlook (San Diego County) Hauer SSP2
- Today (2025)
- 3,678,185 people
- By 2030
- 3,856,546 · +4.8%
- By 2040
- 4,171,407 · +13.4%
- By 2050
- 4,421,607 · +20.2%
- By 2075
- 4,831,599 · +31.4%
- By 2100
- 4,832,502 · +31.4%
Race, ethnicity, and origin ACS 2023
- Neighborhood character
- Predominantly Hispanic (75%)
- Race & ethnicity
- Hispanic / Latino 75% Two or more races 34% White 12% Asian 7% Black 4% Native American 1%
- Hispanic origin (detail)
- Mexican 71%
- Common ancestry
- Italian 1% Lithuanian 1%
- Foreign-born
- 32% · Canada, South Korea, Dominican Republic
- Languages at home
- 35% English-only · Spanish 59% Tagalog/Filipino 3% Other Asian/Pacific 1%
Political lean MEDSL · San Diego
- 2024 margin
- D (+16.8) · D 56.9% · R 40.1% · Other 2.9%
- 2008→2024 swing
- +6.6pp toward D · 2008: 10.2pp · 2024: 16.8pp
- All cycles
- 2024: D+16.8 2020: D+22.8 2016: D+17.8 2012: D+5.1 2008: D+10.2
Not yet ingested
- Civics
- —
Market trends
- HPI YoY
- ▼ -669.25%
- Current HPI
- 413.8287
- Rent YoY
- ▼ -2.56%
- Metro
- San Diego-Chula Vista-Carlsbad, CA
- State GDP YoY
- ▲ 3.21%
- F500 in state
- 116
Industry mix (Fortune 500 HQ in CA)
| Industry | F500 HQs | Revenue |
|---|---|---|
| Technology | 27 | $1,492B |
|
||
| Financial Services | 3 | $174B |
|
||
| Retail | 3 | $44B |
|
||
| Insurance | 3 | $26B |
|
||
| Media / Entertainment | 2 | $115B |
|
||
| Pharmaceuticals / Biotech | 2 | $62B |
|
||
Price history
+103.7% since first listed7 events — show timeline
- 2026-05-23 Listed $55,000 CRMLS
- 2023-08-21 Listing Removed — CRMLS
- 2023-05-18 Listed $299,999 CRMLS
- 2022-12-26 Listing Removed — CRMLS
- 2022-12-05 Listed $268,000 CRMLS
- 2005-05-06 Sold (Public Records) $169,000 Public Records
- 1987-08-26 Sold (Public Records) $27,000 Public Records
Property tax history
+2.0%/yrLatest (2025): $2,352 · +110.3% YoY. Source: county tax records.
Cash-flow waterfall
monthlySold comps — $/sqft
last 12 mo · ≤1 miLoading sold comps…