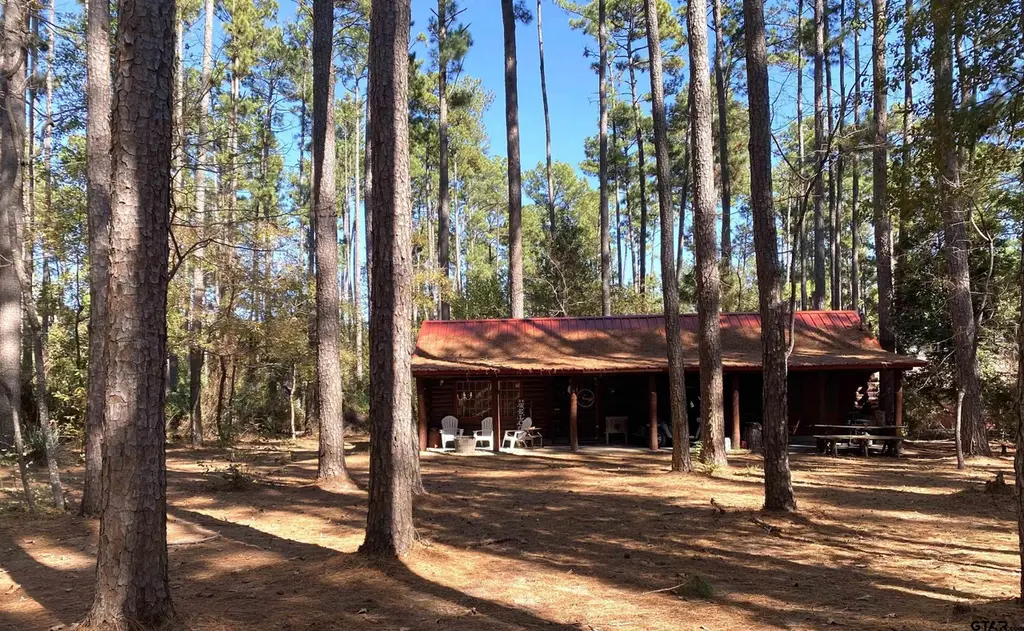
142 Pine Cone Gln
Holly Lake Ranch, TX 75765
$164,000C-
2 bd · 2.0 ba ·
1,092 sqft ·
Built 1985
· SingleFamily
· Active
· 228 DOM
Cashflow @ list (25.0% down · 7.5%)
Estimated rent
$1,628/mo
Mortgage (P&I)
−$860
Tax + insurance
−$287
HOA
−$179
Vac / Maint / Mgmt
−$342
Net cashflow
$-40/mo
Annual
$-484/yr
Cap rate
6.00%
Cash-on-cash
-1.05%
DSCR
0.95
1% rule
0.99%
Cash to close
$45,920
Investor read
- This is a 2-bed/2.0-bath single-family listed at $164k.
- At list price, monthly cash flow is $-40 ($-484/yr) — negative.
- To cash-flow at today's rent, offer at most $157k (4.3% below list).
- To meet the 1% rule (rent ≥ 1% of price), the offer needs to be $163k (0.8% below list).
- It's been on market 228 days — a 12% lower offer ($144k) is reasonable based on typical stale-listing flexibility.
- Recommended offer: $144k (12.0% below list) — sets the bar for market timing.
- In year one you build about $6k of equity ($1k loan paydown + $5k appreciation (3.1% local appreciation)).
- Location reads 66/100 on livability (#597 in TX) — a middle-class / working-renter tenant base. Strengths: crime A+, cost of living A+, housing A+; Watch: schools D-, amenities F, commute F.
- Harmony ISD (rural): math 48% / reading 47% proficiency, ranked #224 of 826 in TX (top 27%) — families likely to look elsewhere, expect single-tenant / working-renter base with shorter leases.
- Market conditions: 216 active listings in the ZIP; 72 units permitted in Wood County in 2024 (29 in 5+ unit buildings).
- Wood County population projected at +12% by 2050 — modest demand growth; plan on rents tracking national, not racing it.
- At projected returns (3.1% appreciation + 3.0% rent growth), your $46k cash investment doubles in ~7 years — after that, you're playing with house money.
- By year 6, paydown + projected appreciation supports a ~$33k cash-out refi (75% LTV) — recoverable capital for the next deal without selling this one.
- Climate carrying-cost: major wind risk, 44% chance of damaging wind over 30y; extreme-heat days projected 6→22/yr by 2055 (HVAC capex compounding) — expect insurance premiums to compound above CPI over the hold.
- Cap rate 6.0% vs local median 3.8% in Holly Lake Ranch — top-decile yield for the area; either an underpriced asset or a hidden risk that comps aren't pricing in. Stress-test before assuming the spread holds.
Questions for listing agent
- What do current leases actually rent for vs. the listed asking? Can we see a recent rent roll and the last 12 months of T-12 income?
- It's been on market 228 days. Have you received any prior offers? Is the seller open to a 12% concession, seller financing, or rate buy-down credit?
- What does the HOA fee cover, when was the last increase, and are there any pending special assessments or reserve-fund shortfalls?
- Why hasn't it sold? Are there any deal-killer items the seller is aware of (foundation, flood, title, zoning, code violations)?
- Is there a deadline driving the sale (1031 exchange, divorce, estate, relocation)? That informs how much negotiation room exists.
- Schools are D-rated, which usually means shorter tenancies and higher turnover. Who's the typical renter profile here, and what's been the actual vacancy rate?
- What's the average days-on-market for RENTAL listings here right now (not sales)? A rising rental-DOM trend means longer vacancies and softer asking-rent achievability than the comps imply.
- What's the recent tenant-quality profile in this submarket — average credit score on applications, eviction rate, late-payment / NSF rate, and stable-employment percentage? A property-management company in the area should have these aggregated.
CashFlowRE · CFR-R48D0HAM2NQRH3
· Data 2 days ago
cashflowre.app · 2026-05-29