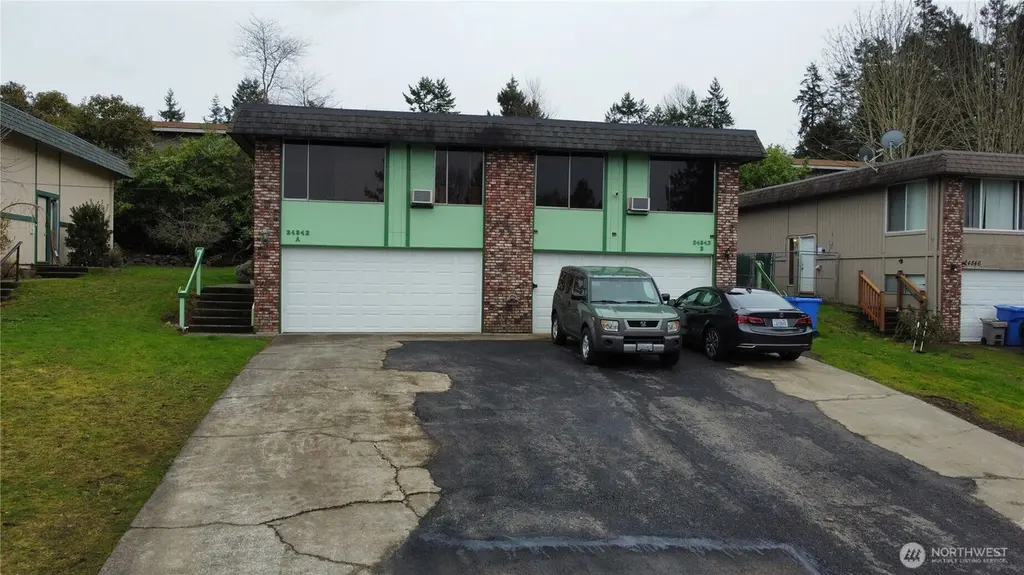
24842 96th Ave S
Kent, WA 98030
$635,000D-
4 bd · 4.0 ba ·
2,240 sqft ·
Built 1974
· MultiFamily
· Pending
· 87 DOM
Cashflow @ list (25.0% down · 7.5%)
Estimated rent
$3,947/mo
Mortgage (P&I)
−$3,330
Tax + insurance
−$819
HOA
−$0
Vac / Maint / Mgmt
−$829
Net cashflow
$-1,031/mo
Annual
$-12,371/yr
Cap rate
4.34%
Cash-on-cash
-6.96%
DSCR
0.69
1% rule
0.62%
Cash to close
$177,800
Investor read
- This is a 2 × 2-bed/2.0-bath units multifamily listed at $635k.
- At list price, monthly cash flow is $-1k ($-12k/yr) — negative. Per door: $-515/mo.
- To cash-flow at today's rent, offer at most $453k (28.7% below list).
- To meet the 1% rule (rent ≥ 1% of price), the offer needs to be $395k (37.8% below list).
- It's been on market 87 days — a 6% lower offer ($597k) is reasonable based on typical stale-listing flexibility.
- Recommended offer: $395k (37.8% below list) — sets the bar for 1% rule.
- Local home prices are declining (-3.0%/yr); year-one equity from $4k of loan paydown is wiped out by about $19k of value loss. Plan a longer hold.
- Location reads 79/100 on livability (#109 in WA, #2,154 nationally) — a middle-class / working-renter tenant base. Strengths: amenities A+, commute A+, housing A+; Watch: schools C-, crime F, cost of living F.
- Kent School District (urban): math 47% / reading 57% proficiency, ranked #109 of 291 in WA (top 38%) — acceptable for families but not a draw, mixed tenant base, ~2y average lease.
- Market conditions: Rents rising (+3.7%/yr); 171 active listings in the ZIP; 12 comparable units currently listed for rent nearby; rentals at typical pace (median 24d on market — plan ~3-4 weeks tenant-placement turnaround); 42% of comp listings sitting > 30 days — soft ceiling on asking rent; solid renter incomes; 10,555 units permitted in King County in 2024 (7,119 in 5+ unit buildings).
- King County population projected at +44% by 2050 — long-run rental-demand tailwind backs the buy-and-hold thesis.
- 2 sale attempts since 23y ago; this cycle's ask has dropped $34k (5%) from the opening price — seller is motivated, your offer sets the floor, not the list.
- Current owner paid $262k; list at $635k implies a 142% gain — meaningful room to come down on a strong offer.
- Cap rate 4.3% vs local median 2.7% in Kent — top-decile yield for the area; either an underpriced asset or a hidden risk that comps aren't pricing in. Stress-test before assuming the spread holds.
- At $3,947/mo this rent would consume 52% of the median local household income ($92k/yr) (locally 1415% of renters already pay >50% of income on rent) — very limited rent-growth headroom before tenants either downsize or default.
Questions for listing agent
- What do current leases actually rent for vs. the listed asking? Can we see a recent rent roll and the last 12 months of T-12 income?
- It's been on market 87 days. Have you received any prior offers? Is the seller open to a 38% concession, seller financing, or rate buy-down credit?
- Can we see the unit-by-unit rent roll, current vacancy, and any below-market leases? What's the average tenancy length?
- What capital expenditures (roof, boiler, parking lot, exteriors) have been made in the last 5 years, and what's planned in the next 2?
- Built in 1974 — when were the roof, HVAC, electrical panel, plumbing, and water heater last replaced?
- Why hasn't it sold? Are there any deal-killer items the seller is aware of (foundation, flood, title, zoning, code violations)?
- Is there a deadline driving the sale (1031 exchange, divorce, estate, relocation)? That informs how much negotiation room exists.
- Crime grade is F in this area — have there been break-ins, vandalism, or insurance claims at this property in the last 3 years? What carrier currently insures it and at what premium?
CashFlowRE · CFR-R4DYRRD43EFFW1
· Data 3 weeks ago
cashflowre.app · 2026-05-29