 Duplex
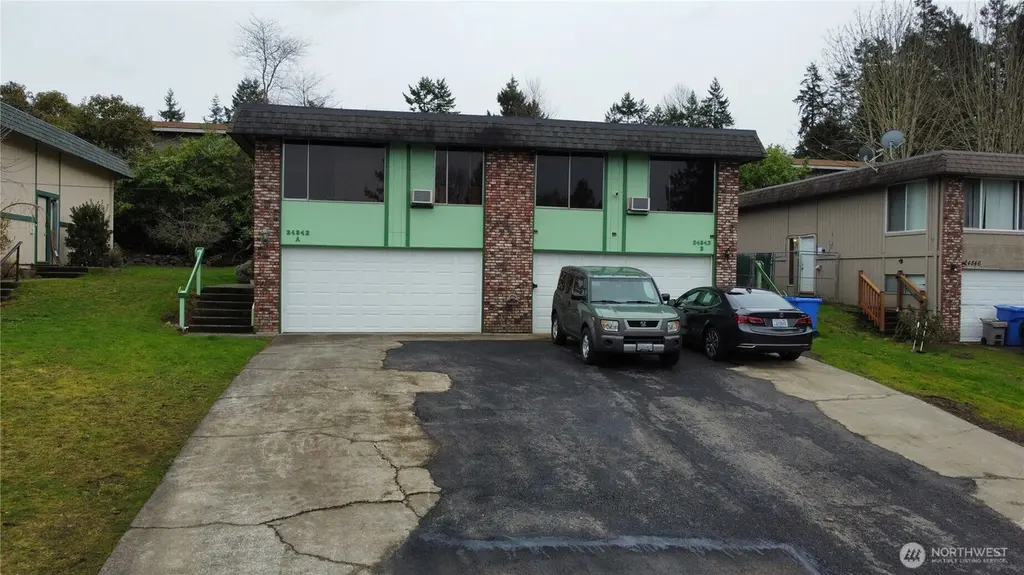
24842 96th Ave S · Kent, WA
Flood risk 1/10 · Minimal
- FEMA flood zone
- X (unshaded)
- Chance of flooding over 30 yrs
- 0.0%
- Est. flood insurance / yr
- $473 – $860
Fire risk 1/10 · Minimal
- Est. fire insurance / yr
- $604 – $1,122
Heat risk 3/10 · Minor
- Hot days now (above 87°F)
- 7 days/yr
- Hot days in 30 yrs
- 14 days/yr
Wind risk 1/10 · Minimal
- Chance of severe wind over 30 yrs
- —
Air-quality risk 8/10 · Major
- Unhealthy air days now
- 12 days/yr
- Unhealthy air days in 30 yrs
- 12 days/yr
Risk factors via First Street. Map © Google.
Why this score? — see what drove the D- grade
The composite is a weighted blend of 9 inputs, each scored 0–100. Each bar is that input's sub-score; the figure is the points it added to the 100-point composite (weight × sub-score).
- ARV discount +15.0/15.0
- Cash flow +6.6/30.0
- Schools +4.8/10.0
- Livability +4.0/5.0
- Rent growth +3.4/5.0
- Condition / age +2.5/5.0
- 1% rule +1.2/10.0
- DSCR +0.9/10.0
- Appreciation +0.0/10.0
$635,000
🖨 Deal sheet 📄 Offer letter ✓ Due diligence
Multi-family units
County records classify this as Multi-Family (2-4 Unit). Listing-text estimate: 2 units. confirmed
Listing remarks
Nestled in the heart of Kent, Washington, this exceptional duplex is a rare gem for both investors and homeowners. Its prime location, spacious layout, and thoughtful details make it a standout in today’s competitive market. Each unit is bathed in natural light, creating a warm and inviting ambiance. The open-concept living and dining areas are ideal for entertaining or unwinding, while fully equipped kitchens with ample cabinetry and counter space make meal prep a breeze. Both units feature generously sized bedrooms and the everyday convenience of in-unit laundry. One of this property’s standout features is the rare inclusion of a two-car garage for each unit—offering unp
Key facts
- Large shared yard
- In unit laundry
- Two car garage
Tags
Neighborhood map
What this means for you Summary
Snapshot
- This is a 2 × 2-bed/2.0-bath units multifamily listed at $635k.
Deal economics
- At list price, monthly cash flow is $-1k ($-12k/yr) — negative. Per door: $-515/mo.
- To cash-flow at today's rent, offer at most $453k (28.7% below list).
- To meet the 1% rule (rent ≥ 1% of price), the offer needs to be $395k (37.8% below list).
- Recommended offer: $395k (37.8% below list) — sets the bar for 1% rule.
- Cap rate 4.3% vs local median 2.7% in Kent — top-decile yield for the area; either an underpriced asset or a hidden risk that comps aren't pricing in. Stress-test before assuming the spread holds.
Location & tenants
- Location reads 79/100 on livability (#109 in WA, #2,154 nationally) — a middle-class / working-renter tenant base. Strengths: amenities A+, commute A+, housing A+; Watch: schools C-, crime F, cost of living F.
- Kent School District (urban): math 47% / reading 57% proficiency, ranked #109 of 291 in WA (top 38%) — acceptable for families but not a draw, mixed tenant base, ~2y average lease.
- Market conditions: Rents rising (+3.7%/yr); 171 active listings in the ZIP; 12 comparable units currently listed for rent nearby; rentals at typical pace (median 24d on market — plan ~3-4 weeks tenant-placement turnaround); 42% of comp listings sitting > 30 days — soft ceiling on asking rent; solid renter incomes; 10,555 units permitted in King County in 2024 (7,119 in 5+ unit buildings).
- At $3,947/mo this rent would consume 52% of the median local household income ($92k/yr) (locally 1415% of renters already pay >50% of income on rent) — very limited rent-growth headroom before tenants either downsize or default.
Forward outlook
- Local home prices are declining (-3.0%/yr); year-one equity from $4k of loan paydown is wiped out by about $19k of value loss. Plan a longer hold.
- King County population projected at +44% by 2050 — long-run rental-demand tailwind backs the buy-and-hold thesis.
Negotiation context
- It's been on market 87 days — a 6% lower offer ($597k) is reasonable based on typical stale-listing flexibility.
- 2 sale attempts since 23y ago; this cycle's ask has dropped $34k (5%) from the opening price — seller is motivated, your offer sets the floor, not the list.
- Current owner paid $262k; list at $635k implies a 142% gain — meaningful room to come down on a strong offer.
Questions for the listing agent
- What do current leases actually rent for vs. the listed asking? Can we see a recent rent roll and the last 12 months of T-12 income?
- It's been on market 87 days. Have you received any prior offers? Is the seller open to a 38% concession, seller financing, or rate buy-down credit?
- Can we see the unit-by-unit rent roll, current vacancy, and any below-market leases? What's the average tenancy length?
- What capital expenditures (roof, boiler, parking lot, exteriors) have been made in the last 5 years, and what's planned in the next 2?
- Built in 1974 — when were the roof, HVAC, electrical panel, plumbing, and water heater last replaced?
- Why hasn't it sold? Are there any deal-killer items the seller is aware of (foundation, flood, title, zoning, code violations)?
- Is there a deadline driving the sale (1031 exchange, divorce, estate, relocation)? That informs how much negotiation room exists.
- Crime grade is F in this area — have there been break-ins, vandalism, or insurance claims at this property in the last 3 years? What carrier currently insures it and at what premium?
- The area grade is low — what's the realistic commute time and amenity access for the typical tenant pool here? Any planned neighborhood developments (good or bad) we should know about?
- What's the average days-on-market for RENTAL listings here right now (not sales)? A rising rental-DOM trend means longer vacancies and softer asking-rent achievability than the comps imply.
- What's the recent tenant-quality profile in this submarket — average credit score on applications, eviction rate, late-payment / NSF rate, and stable-employment percentage? A property-management company in the area should have these aggregated.
- How much new apartment / multifamily construction is in the pipeline within 1–3 miles? Heavy new supply (>2% of stock underway) typically softens rents 12–24 months out; light construction supports rent growth.
Investment metrics
- 1% rule
- 0.62% ✗
- Cap rate
- 4.34%
- Cash-on-cash
- -6.96%
- DSCR
- 0.69
- GRM
- 13.4
CMA / ARV
- ARV (median comp)
- $779,227
- List price
- $635,000
- Delta
- -18.51%
- Verdict
- UNDERPRICED
- Comps
- 2 within 1.0 mi
Projected returns pro-forma
-3.0% appreciation · 3.72% rent growth · sell at horizon
- IRR
- -27.7%
- Equity multiple
- 0.07×
- Total profit
- $-165,762
- Equity at exit
- $94,681
- IRR
- -23.9%
- Equity multiple
- -0.22×
- Total profit
- $-217,251
- Equity at exit
- $54,903
Cash invested: $177,800 (down + closing). Projections, not guarantees.
Landlord ↔ Tenant lean methodology
- Overall (STATE)
- 28 Tenant-Leaning
- State Washington
- 28 Tenant-Leaning · D+8
- County
- — inherits STATE
- City
- — inherits STATE
ZIP-level market 98030
- Rents YoY
- 3.7%
- Active inventory
- 171
- Price-to-rent
- 26.8×
Monthly cashflow live
- Estimated rent
- $3,947 high interval (Pro) →
- Mortgage (P&I)
- −$3,330
- Tax from tax record
- −$554 /mo · $6,653/yr
- Insurance
- −$265
- HOA
- −$0
- Vacancy / Maint / Mgmt
- −$829
- Net cashflow
- $-1,031
Break-even live
2-unit breakdown (identical units grouped — click to expand)
| Units | Beds | Baths | Est. rent |
|---|---|---|---|
| 2× units | 2 | 2 | $3,948 |
| #1 | 2 | 2 | $1,974 |
| #2 | 2 | 2 | $1,974 |
| Total (2 units) | $3,947 | ||
UW: 25.0% down · 7.5% · 30yr · 1.5% tax · 5.0% vac · 8.0% maint · 8.0% mgmt
Financing live
Cash to close
- Down payment
- $158,750
- Closing costs
- $19,050
- Reserves months
- —
- Total cash needed
- —
Loan-product check · same deal, 3 products live
Conventional
25% down · 7.5% · 30yr
- Down + closing
- —
- Monthly P&I
- —
- Monthly cashflow
- —
- DSCR
- —
- Eligible?
- —
Personal DTI + credit; lowest rate.
DSCR
20% down · 8.5% · 30yr
- Down + closing
- —
- Monthly P&I
- —
- Monthly cashflow
- —
- DSCR
- —
- Eligible?
- —
No personal income docs; deal must DSCR.
Hard money
10% down · 12.0% · 12mo
- Down + closing
- —
- Monthly P&I
- —
- Monthly cashflow
- —
- DSCR
- —
- Eligible?
- —
Short-term bridge; refi at stabilization.
Rent comps 12 comps
| Address | Beds | Baths | Sqft | Rent | $/sqft | DOM | Units | Dist |
|---|---|---|---|---|---|---|---|---|
| 1220 E Laurel St Kent, WA | 3.0 | 2.0 | 1580 | $2,995 | $1.90 | 12d | 1 | 0.38mi |
| 10031 SE 258th Pl Kent, WA | 3.0 | 2.0–2.5 | 1454 | $2,968 | $2.04 | 2d | 3 | 0.71mi |
| 23533 97th Ave S Kent, WA | 4.0 | 2.5 | 2040 | $3,300 | $1.62 | 43d | 1 | 0.80mi |
| 10217 SE 237th St Kent, WA | 3.0 | 3.0 | 2412 | $3,200 | $1.33 | 24d | 1 | 0.84mi |
| 11226 SE 254th St Kent, WA | 5.0 | 3.0 | 2960 | $4,890 | $1.65 | 43d | 1 | 1.08mi |
| 11226 SE 254th St Lot 1 Kent, WA | 5.0 | 3.0 | 2960 | $4,990 | $1.69 | 43d | 1 | 1.08mi |
| 401 3rd Ave S Unit Lower Kent, WA | 3.0 | 2.0 | 2000 | $2,780 | $1.39 | 43d | 1 | 1.10mi |
| 11506 SE 253rd Pl Kent, WA | 4.0 | 2.5 | 2812 | $4,200 | $1.49 | 24d | 1 | 1.21mi |
| 11220 SE 264th St Kent, WA | 4.0 | 3.0 | 2350 | $3,650 | $1.55 | 21d | 1 | 1.39mi |
| 22720 101st Pl SE Kent, WA | 4.0 | 3.5 | 2461 | $10,500 | $4.27 | 21d | 1 | 1.40mi |
| 507 W Concord St Unit 507 Kent, WA | 4.0 | 2.5 | 2090 | $4,500 | $2.15 | 43d | 1 | 1.41mi |
| 24115 118th Pl SE Kent, WA | 4.0 | 3.0 | 2378 | $3,700 | $1.56 | 12d | 1 | 1.44mi |
Listing history 7 events
-
2026-04-23price $635,000
-
2026-02-25$669,000 Active
-
2003-03-25soldstatus $262,500
-
2003-03-25soldstatus $262,500
-
2003-02-01$270,000
-
1987-12-29soldstatus $120,000
-
1978-12-07soldstatus $73,000
ⓘ Source: listings_history table (triggers on properties + properties_extension) + one-shot
backfill from property_details.listing_events for pre-trigger history.
Tax reassessment forecast WA · Resets to sale price
- Current annual tax
- $6,653 · $554/mo
- Projected year-2 tax
- $6,653 · $554/mo
- Expected delta
- $0/yr ($0/mo · 0.0%)
ⓘ Screening estimate from a state-policy table — verify with the county assessor before closing.
Climate risk First Street
- Flood 1/10 Low FEMA zone X (unshaded) · 0% chance over 30 yrs
- Wildfire 1/10 Low
- Heat 3/10 Moderate 7 d/yr ≥87°F today · 14 d/yr by 30 yrs out
- Wind 1/10 Low
- Air quality 8/10 Severe 12 unhealthy d/yr today · 12 by 30 yrs out
Nearby sold comps map
Loading sold comps map…
Walkable amenities ~0.75 mi
Loading nearby amenities…
Taxation est. · year 1
- Rental income
- $47,364
- − Mortgage interest
- −$35,570
- − Property taxes
- −$6,653
- − Insurance
- −$3,175
- − Repairs & maintenance
- −$3,789
- − Management
- −$3,789
- − Depreciation
- −$18,473
- Taxable loss
- −$24,085
- Est. tax savings @ 24.0%
- +$5,780
- After-tax cash flow
- $-6,590/yr
For passive investors: Depreciation is non-cash, so a rental often shows a tax loss while cash-flowing — sheltering income. Rental losses are passive: they offset passive income freely, and up to $25,000/yr can offset ordinary (W-2) income if you actively participate and your MAGI is under $100k (phasing out to $0 by $150k); unused losses carry forward. On sale, claimed depreciation is recaptured at up to 25%, and gains may owe capital-gains tax (a 1031 exchange can defer both). Figures are a year-1 estimate at your 24.0% rate — not tax advice; consult a CPA.
Schools (NCES district)
- District
- Kent School District
- NCES district ID
- 5303960
- Math proficiency
- 47% ▼ -1.00%
- Reading proficiency
- 57% ▼ -1.00%
- Median HH income
- $69,823
- Composite
- 48.25/100
- National rank
- #4714
- State rank
- #109 of 291 in WA
Livability — Kent
- Score
- 79/100
- State rank
- #109
- US rank
- #2154
Category grades
Schools grade is shown separately in the Schools card above.
Census & demographics
- Census place
- Kent, WA
- County
- King County · 2,251,916 people
- City population
- 119,479
- Metro
- Seattle-Tacoma-Bellevue, WA
- Population (ZIP)
- 38,523
- Household income
- $91,761
- Rent vs Own
- Severe rent burden
- 1415.0
Population outlook (King County) Hauer SSP2
- Today (2025)
- 2,576,485 people
- By 2030
- 2,803,316 · +8.8%
- By 2040
- 3,255,921 · +26.4%
- By 2050
- 3,706,444 · +43.9%
- By 2075
- 4,746,063 · +84.2%
- By 2100
- 5,407,730 · +109.9%
Race, ethnicity, and origin ACS 2023
- Neighborhood character
- Highly diverse neighborhood (Simpson 0.74)
- Race & ethnicity
- White 41% Asian 24% Hispanic / Latino 15% Black 11% Two or more races 9% Pacific Islander 3%
- Hispanic origin (detail)
- Mexican 12%
- Common ancestry
- Subsaharan African 6% Italian 4% Portuguese 2%
- Foreign-born
- 36% · Canada, Vietnam, Philippines
- Languages at home
- 53% English-only · Spanish 10% Other Indo-European 9% Other Asian/Pacific 8%
Political lean MEDSL · King
- 2024 margin
- Solid D (+51.7) · D 74.2% · R 22.5% · Other 3.4%
- 2008→2024 swing
- +9.6pp toward D · 2008: 42.1pp · 2024: 51.7pp
- All cycles
- 2024: D+51.7 2020: D+52.7 2016: D+50.4 2012: D+39.9 2008: D+42.1
Not yet ingested
- Civics
- —
Market trends
- HPI YoY
- ▼ -494.18%
- Current HPI
- 315.2007
- Rent YoY
- ▲ 3.72%
- Metro
- Seattle-Tacoma-Bellevue, WA
- State GDP YoY
- ▲ 4.65%
- F500 in state
- 22
Industry mix (Fortune 500 HQ in WA)
| Industry | F500 HQs | Revenue |
|---|---|---|
| Retail | 2 | $269B |
|
||
| Technology / Retail | 1 | $638B |
|
||
| Technology | 1 | $245B |
|
||
| Telecommunications | 1 | $38B |
|
||
| Food / Beverage | 1 | $36B |
|
||
| Automotive / Trucks | 1 | $34B |
|
||
Price history
+769.9% since first listed7 events — show timeline
- 2026-04-23 Price Changed $635,000 NWMLS as Distributed by MLS Grid
- 2026-02-25 Listed $669,000 NWMLS as Distributed by MLS Grid
- 2003-03-25 Sold (Public Records) $262,500 Public Records
- 2003-03-25 Sold (MLS) $262,500 NWMLS as Distributed by MLS Grid
- 2003-02-01 Listed $270,000 NWMLS as Distributed by MLS Grid
- 1987-12-29 Sold (Public Records) $120,000 Public Records
- 1978-12-07 Sold (Public Records) $73,000 Public Records
Property tax history
+3.8%/yrLatest (2025): $6,653 · +7.3% YoY. Source: county tax records.
Cash-flow waterfall
monthlySold comps — $/sqft
last 12 mo · ≤1 miLoading sold comps…