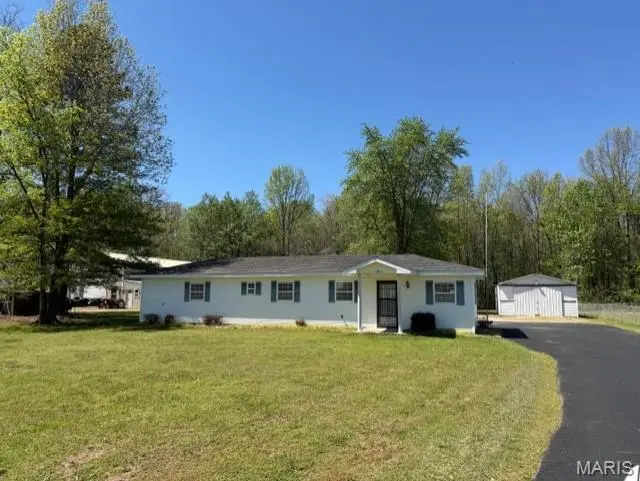
1571 Highway AA
Poplar Bluff, MO 63901
$139,500D
2 bd · 2.0 ba ·
1,008 sqft ·
Built 1995
· Other
· Pending
· 22 DOM
Cashflow @ list (25.0% down · 7.5%)
Estimated rent
$1,044/mo
Mortgage (P&I)
−$732
Tax + insurance
−$233
HOA
−$0
Vac / Maint / Mgmt
−$219
Net cashflow
$-139/mo
Annual
$-1,672/yr
Cap rate
6.17%
Cash-on-cash
-0.43%
DSCR
0.98
1% rule
0.75%
Cash to close
$39,060
Investor read
- This is a 2-bed/2.0-bath other listed at $140k.
- At list price, monthly cash flow is $-139 ($-2k/yr) — negative.
- To cash-flow at today's rent, offer at most $115k (17.6% below list).
- To meet the 1% rule (rent ≥ 1% of price), the offer needs to be $104k (25.2% below list).
- It's been on market 22 days — a 2% lower offer ($137k) is reasonable based on typical stale-listing flexibility.
- Recommended offer: $104k (25.2% below list) — sets the bar for 1% rule.
- Local home prices are declining (-3.0%/yr); year-one equity from $964 of loan paydown is wiped out by about $4k of value loss. Plan a longer hold.
- Location reads 70/100 on livability (#143 in MO) — a middle-class / working-renter tenant base. Strengths: crime A+, cost of living A+, housing A+; Watch: amenities F, commute F, employment F.
- Poplar Bluff R-I (town): math 38% / reading 47% proficiency, ranked #127 of 324 in MO (top 39%) — families likely to look elsewhere, expect single-tenant / working-renter base with shorter leases.
- Zoned schools: Lake Road Elem. (math 48% / reading 55%, grade C-, #268 of 1,115 statewide, top 24%, 305 students, 99% FRL); Poplar Bluff High (math 22% / reading 42%, grade F, #356 of 521 statewide, top 71%, 1,504 students, 56% FRL) — zoned schools average 78% FRL vs 56% district-wide (21 pts higher); higher-poverty schools than district average — tighter screening recommended.
- Watch-outs: flood insurance adds $125/mo.
- Market conditions: 274 active listings in the ZIP; 63 units permitted in Butler County in 2024 (48 in 5+ unit buildings).
- Butler County population projected to shrink 6% by 2050 — rents likely to lag national; underwrite the cash flow, not the appreciation.
- Climate carrying-cost: in FEMA flood zone A (mandatory federal flood insurance); extreme-heat days projected 7→20/yr by 2055 (HVAC capex compounding) — expect insurance premiums to compound above CPI over the hold.
- Cap rate 6.2% vs local median 4.4% in Poplar Bluff — top-decile yield for the area; either an underpriced asset or a hidden risk that comps aren't pricing in. Stress-test before assuming the spread holds.
Questions for listing agent
- What do current leases actually rent for vs. the listed asking? Can we see a recent rent roll and the last 12 months of T-12 income?
- What's the actual annual flood-insurance premium (NFIP or private), and is the property in a SFHA with mandatory coverage?
- Is there a deadline driving the sale (1031 exchange, divorce, estate, relocation)? That informs how much negotiation room exists.
- The area grade is low — what's the realistic commute time and amenity access for the typical tenant pool here? Any planned neighborhood developments (good or bad) we should know about?
- What's the average days-on-market for RENTAL listings here right now (not sales)? A rising rental-DOM trend means longer vacancies and softer asking-rent achievability than the comps imply.
- What's the recent tenant-quality profile in this submarket — average credit score on applications, eviction rate, late-payment / NSF rate, and stable-employment percentage? A property-management company in the area should have these aggregated.
- How much new for-sale + rental construction is in the pipeline within 1–3 miles? Heavy new supply typically softens prices + rents 12–24 months out; constrained supply supports both.
CashFlowRE · CFR-R512H4917JT1HM
· Data 6 days ago
cashflowre.app · 2026-05-29