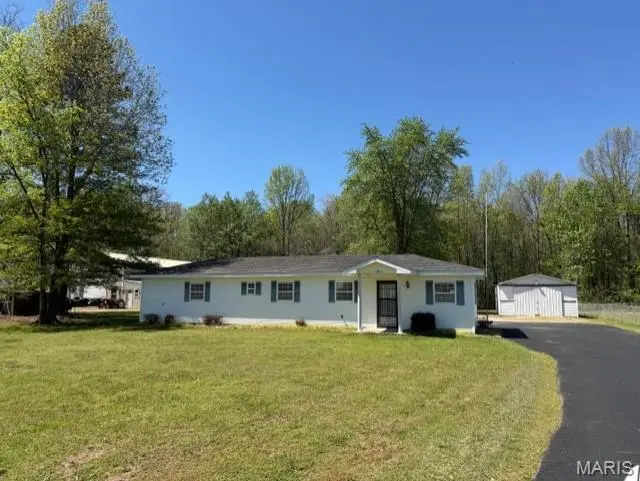
1571 Highway AA · Poplar Bluff, MO
Flood risk 7/10 · Major
- FEMA flood zone
- A
- Chance of flooding over 30 yrs
- 0.77%
- Est. flood insurance / yr
- $1,009 – $1,996
Fire risk 1/10 · Minimal
- Est. fire insurance / yr
- $1,054 – $1,958
Heat risk 5/10 · Moderate
- Hot days now (above 108°F)
- 7 days/yr
- Hot days in 30 yrs
- 20 days/yr
Wind risk 3/10 · Minor
- Chance of severe wind over 30 yrs
- 6.0%
Air-quality risk 2/10 · Minimal
- Unhealthy air days now
- 0 days/yr
- Unhealthy air days in 30 yrs
- 1 days/yr
Risk factors via First Street. Map © Google.
Why this score? — see what drove the D grade
The composite is a weighted blend of 9 inputs, each scored 0–100. Each bar is that input's sub-score; the figure is the points it added to the 100-point composite (weight × sub-score).
- Cash flow +12.7/30.0
- ARV discount +12.3/15.0
- DSCR +3.8/10.0
- Schools +3.5/10.0
- Livability +3.5/5.0
- 1% rule +2.5/10.0
- Rent growth +2.5/5.0
- Condition / age +2.5/5.0
- Appreciation +0.0/10.0
$139,500
🖨 Deal sheet 📄 Offer letter ✓ Due diligence
Listing remarks
Delightful and inviting! This well-kept 2-bedroom, 2 bath home offers 1,200 +/- sq ft of comfortable living space. Inside, you'll find a bright and cozy layout with raised ceilings in living area, complete with a sunroom that's ideal for relaxing or enjoying your morning coffee. The generous level yard provides plenty of space for outdoor living. Very nice paved driveway and lots of parking area for entertaining and metal carport for covered parking as well. The 20x40 shop with concrete floor and electric is a great addition that provides a multitude of uses anyone would love!! This property is well maintained and located in a good location for country living but only a few minutes from tow
Key facts
- Raised ceilings
- Generous yard
- Covered parking
Tags
Property features AI
Exterior
- Parking: Driveway; Asphalt parking; Carport (1 space); Additional parking
- Utilities: Public water; Public sewer; Single-phase electric; Cable available
- Home design: Single-family residence; One level
- Construction: Vinyl siding; Shingle roof
- Exterior features: Terrace patio/porch; Front yard; RV/boat storage; Workshop
Interior
- Kitchen: Equipped with dishwasher, oven, range and refrigerator
- Bedrooms: 2 bedrooms on the main level
- Bathrooms: 2 full bathrooms (main level)
- Heating & cooling: Electric heating; Central air conditioning
- Interior features: Dishwasher, Oven, Range, Refrigerator; No basement
Neighborhood map
What this means for you Summary
Snapshot
- This is a 2-bed/2.0-bath other listed at $140k.
Deal economics
- At list price, monthly cash flow is $-139 ($-2k/yr) — negative.
- To cash-flow at today's rent, offer at most $115k (17.6% below list).
- To meet the 1% rule (rent ≥ 1% of price), the offer needs to be $104k (25.2% below list).
- Recommended offer: $104k (25.2% below list) — sets the bar for 1% rule.
- Cap rate 6.2% vs local median 4.4% in Poplar Bluff — top-decile yield for the area; either an underpriced asset or a hidden risk that comps aren't pricing in. Stress-test before assuming the spread holds.
Location & tenants
- Location reads 70/100 on livability (#143 in MO) — a middle-class / working-renter tenant base. Strengths: crime A+, cost of living A+, housing A+; Watch: amenities F, commute F, employment F.
- Poplar Bluff R-I (town): math 38% / reading 47% proficiency, ranked #127 of 324 in MO (top 39%) — families likely to look elsewhere, expect single-tenant / working-renter base with shorter leases.
- Zoned schools: Lake Road Elem. (math 48% / reading 55%, grade C-, #268 of 1,115 statewide, top 24%, 305 students, 99% FRL); Poplar Bluff High (math 22% / reading 42%, grade F, #356 of 521 statewide, top 71%, 1,504 students, 56% FRL) — zoned schools average 78% FRL vs 56% district-wide (21 pts higher); higher-poverty schools than district average — tighter screening recommended.
- Market conditions: 274 active listings in the ZIP; 63 units permitted in Butler County in 2024 (48 in 5+ unit buildings).
Forward outlook
- Local home prices are declining (-3.0%/yr); year-one equity from $964 of loan paydown is wiped out by about $4k of value loss. Plan a longer hold.
- Butler County population projected to shrink 6% by 2050 — rents likely to lag national; underwrite the cash flow, not the appreciation.
Negotiation context
- It's been on market 22 days — a 2% lower offer ($137k) is reasonable based on typical stale-listing flexibility.
Risks & watch-outs
- Watch-outs: flood insurance adds $125/mo.
- Climate carrying-cost: in FEMA flood zone A (mandatory federal flood insurance); extreme-heat days projected 7→20/yr by 2055 (HVAC capex compounding) — expect insurance premiums to compound above CPI over the hold.
Questions for the listing agent
- What do current leases actually rent for vs. the listed asking? Can we see a recent rent roll and the last 12 months of T-12 income?
- What's the actual annual flood-insurance premium (NFIP or private), and is the property in a SFHA with mandatory coverage?
- Is there a deadline driving the sale (1031 exchange, divorce, estate, relocation)? That informs how much negotiation room exists.
- The area grade is low — what's the realistic commute time and amenity access for the typical tenant pool here? Any planned neighborhood developments (good or bad) we should know about?
- What's the average days-on-market for RENTAL listings here right now (not sales)? A rising rental-DOM trend means longer vacancies and softer asking-rent achievability than the comps imply.
- What's the recent tenant-quality profile in this submarket — average credit score on applications, eviction rate, late-payment / NSF rate, and stable-employment percentage? A property-management company in the area should have these aggregated.
- How much new for-sale + rental construction is in the pipeline within 1–3 miles? Heavy new supply typically softens prices + rents 12–24 months out; constrained supply supports both.
Investment metrics
- 1% rule
- 0.75% ✗
- Cap rate
- 6.17%
- Cash-on-cash
- -0.43%
- DSCR
- 0.98
- GRM
- 11.1
CMA / ARV
- ARV (median comp)
- $156,260
- List price
- $139,500
- Delta
- -10.73%
- Verdict
- UNDERPRICED
- Comps
- 17 within 1.0 mi
Projected returns pro-forma
-3.0% appreciation · 3.0% rent growth · sell at horizon
- IRR
- -23.5%
- Equity multiple
- 0.19×
- Total profit
- $-31,464
- Equity at exit
- $20,800
- IRR
- -18.3%
- Equity multiple
- 0.01×
- Total profit
- $-38,763
- Equity at exit
- $12,061
Cash invested: $39,060 (down + closing). Projections, not guarantees.
Landlord ↔ Tenant lean methodology
- Overall (STATE)
- 81 Strongly Landlord-Friendly
- State Missouri
- 81 Strongly Landlord-Friendly · R+10
- County
- — inherits STATE
- City
- — inherits STATE
ZIP-level market 63901
- Home prices YoY
- -22.4%
- Active inventory
- 274
- Price-to-rent
- 11.1×
Monthly cashflow live
- Estimated rent
- $1,044 medium interval (Pro) →
- Mortgage (P&I)
- −$732
- Tax from tax record
- −$49 /mo · $591/yr
- Insurance
- −$58
- Flood insurance flood zone
- −$125 /mo · $1,502/yr
- HOA
- −$0
- Vacancy / Maint / Mgmt
- −$219
- Net cashflow
- $-139
Break-even live
UW: 25.0% down · 7.5% · 30yr · 1.5% tax · 5.0% vac · 8.0% maint · 8.0% mgmt
Financing live
Cash to close
- Down payment
- $34,875
- Closing costs
- $4,185
- Reserves months
- —
- Total cash needed
- —
Loan-product check · same deal, 3 products live
Conventional
25% down · 7.5% · 30yr
- Down + closing
- —
- Monthly P&I
- —
- Monthly cashflow
- —
- DSCR
- —
- Eligible?
- —
Personal DTI + credit; lowest rate.
DSCR
20% down · 8.5% · 30yr
- Down + closing
- —
- Monthly P&I
- —
- Monthly cashflow
- —
- DSCR
- —
- Eligible?
- —
No personal income docs; deal must DSCR.
Hard money
10% down · 12.0% · 12mo
- Down + closing
- —
- Monthly P&I
- —
- Monthly cashflow
- —
- DSCR
- —
- Eligible?
- —
Short-term bridge; refi at stabilization.
Listing history 2 events
-
2026-04-29$139,500 Active 702-char remark
-
1995-09-01soldstatus
ⓘ Source: listings_history table (triggers on properties + properties_extension) + one-shot
backfill from property_details.listing_events for pre-trigger history.
Tax reassessment forecast MO · Resets to sale price
- Current annual tax
- $591 · $49/mo
- Projected year-2 tax
- $1,353 · $113/mo
- Expected delta
- +$762/yr (+$64/mo · 129.1%)
ⓘ Screening estimate from a state-policy table — verify with the county assessor before closing.
Climate risk First Street
- Flood 7/10 Severe FEMA zone A · 77% chance over 30 yrs
- Wildfire 1/10 Low
- Heat 5/10 Major 7 d/yr ≥108°F today · 20 d/yr by 30 yrs out
- Wind 3/10 Moderate 6% chance of damaging wind over 30 yrs
- Air quality 2/10 Low 0 unhealthy d/yr today · 1 by 30 yrs out
Nearby sold comps map
Loading sold comps map…
Walkable amenities ~0.75 mi
Loading nearby amenities…
Taxation est. · year 1
- Rental income
- $12,528
- − Mortgage interest
- −$7,814
- − Property taxes
- −$591
- − Insurance
- −$2,200
- − Repairs & maintenance
- −$1,002
- − Management
- −$1,002
- − Depreciation
- −$4,058
- Taxable loss
- −$4,139
- Est. tax savings @ 24.0%
- +$993
- After-tax cash flow
- $-679/yr
For passive investors: Depreciation is non-cash, so a rental often shows a tax loss while cash-flowing — sheltering income. Rental losses are passive: they offset passive income freely, and up to $25,000/yr can offset ordinary (W-2) income if you actively participate and your MAGI is under $100k (phasing out to $0 by $150k); unused losses carry forward. On sale, claimed depreciation is recaptured at up to 25%, and gains may owe capital-gains tax (a 1031 exchange can defer both). Figures are a year-1 estimate at your 24.0% rate — not tax advice; consult a CPA.
Schools (NCES district)
- District
- Poplar Bluff R-I
- NCES district ID
- 2925450
- Math proficiency
- 38% ▼ -4.00%
- Reading proficiency
- 47% ▼ -3.00%
- Median HH income
- $35,761
- Composite
- 35.17/100
- National rank
- #5001
- State rank
- #127 of 324 in MO
Livability — Poplar Bluff
- Score
- 70/100
- State rank
- #143
- US rank
- #8135
Category grades
Schools grade is shown separately in the Schools card above.
Census & demographics
- City population
- 34,920
- Population (ZIP)
- 34,920
Population outlook (Butler County) Hauer SSP2
- Today (2025)
- 42,648 people
- By 2030
- 42,329 · -0.7%
- By 2040
- 41,498 · -2.7%
- By 2050
- 40,308 · -5.5%
- By 2075
- 36,168 · -15.2%
- By 2100
- 28,893 · -32.3%
Race, ethnicity, and origin ACS 2023
- Neighborhood character
- Predominantly White (85%)
- Race & ethnicity
- White 85% Two or more races 6% Black 5% Hispanic / Latino 2%
- Common ancestry
- Slovak 2% Lithuanian 1% Romanian 1%
- Foreign-born
- 1% · Canada
- Languages at home
- 98% English-only · Spanish 1%
Political lean MEDSL · Butler
- 2024 margin
- Solid R (+63.8) · D 17.7% · R 81.5%
- 2008→2024 swing
- -26.4pp toward R · 2008: -37.4pp · 2024: -63.8pp
- All cycles
- 2024: R+63.8 2020: R+62.3 2016: R+61.6 2012: R+46.7 2008: R+37.4
Not yet ingested
- Civics
- —
Market trends
- HPI YoY
- ▼ -50.64%
- Current HPI
- 175.3008
- Rent YoY
- —
- Metro
- —
- State GDP YoY
- ▲ 1.84%
- F500 in state
- 20
Industry mix (Fortune 500 HQ in MO)
| Industry | F500 HQs | Revenue |
|---|---|---|
| Healthcare | 1 | $163B |
|
||
| Insurance | 1 | $21B |
|
||
| Industrial Technology | 1 | $17B |
|
||
| Retail | 1 | $16B |
|
||
| Industrial Distribution | 1 | $10B |
|
||
| Utilities | 1 | $9B |
|
||
Price history
3 events — show timeline
- 2026-05-21 Pending — MARIS as Distributed by MLS Grid
- 2026-04-29 Listed $139,500 MARIS as Distributed by MLS Grid
- 1995-09-01 Sold (Public Records) — Public Records
Property tax history
+1.6%/yrLatest (2025): $591 · -1.3% YoY. Source: county tax records.
Cash-flow waterfall
monthlySold comps — $/sqft
last 12 mo · ≤1 miLoading sold comps…