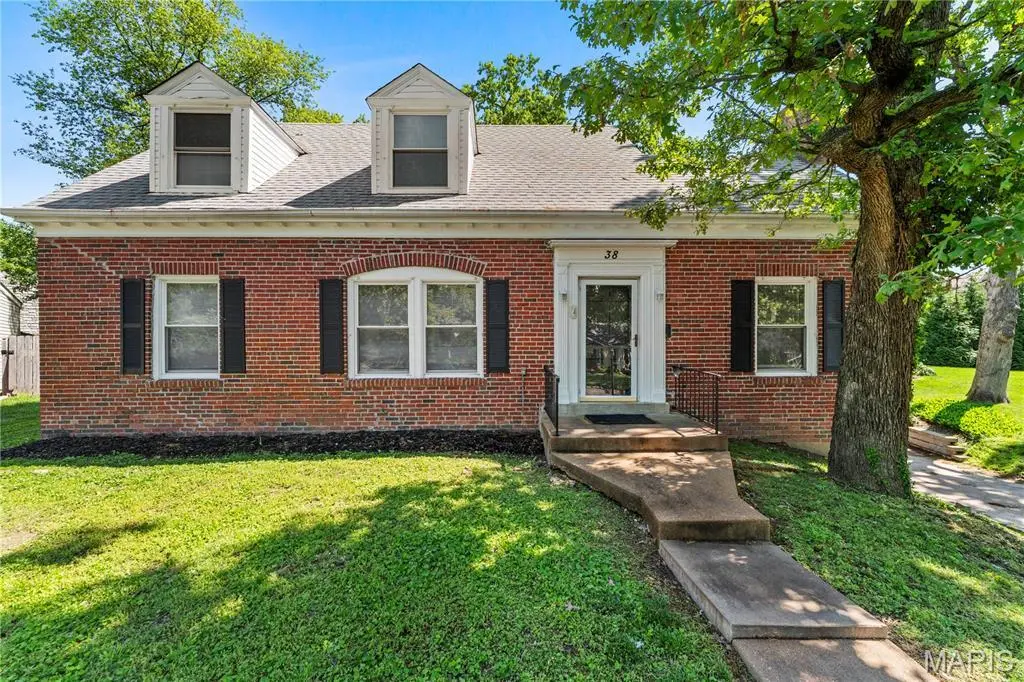
38 Chafford Woods
Richmond Heights, MO 63144
$519,900D
4 bd · 2.0 ba ·
2,145 sqft ·
Built 1947
· SingleFamily
· Active
· 49 DOM
Cashflow @ list (25.0% down · 7.5%)
Estimated rent
$3,352/mo
Mortgage (P&I)
−$2,726
Tax + insurance
−$601
HOA
−$25
Vac / Maint / Mgmt
−$704
Net cashflow
$-705/mo
Annual
$-8,460/yr
Cap rate
4.67%
Cash-on-cash
-5.81%
DSCR
0.74
1% rule
0.64%
Cash to close
$145,572
Investor read
- This is a 4-bed/2.0-bath single-family listed at $520k.
- At list price, monthly cash flow is $-705 ($-8k/yr) — negative.
- To cash-flow at today's rent, offer at most $395k (24.0% below list).
- To meet the 1% rule (rent ≥ 1% of price), the offer needs to be $335k (35.5% below list).
- It's been on market 49 days — a 3% lower offer ($504k) is reasonable based on typical stale-listing flexibility.
- Recommended offer: $335k (35.5% below list) — sets the bar for 1% rule.
- Local home prices are declining (-3.0%/yr); year-one equity from $4k of loan paydown is wiped out by about $16k of value loss. Plan a longer hold.
- Location reads 84/100 on livability (#4 in MO, #652 nationally) — a professional / high-income tenant draw. Strengths: amenities A+, commute A+, employment A+; Watch: crime F.
- Brentwood (suburban): math 65% / reading 66% proficiency, ranked #4 of 324 in MO (top 1%) — acceptable for families but not a draw, mixed tenant base, ~2y average lease; only 18% free/reduced lunch — higher-income household profile.
- Zoned schools: Mcgrath Elem. (math 67% / reading 67%, grade B+, #46 of 1,115 statewide, top 5%, 195 students, 16% FRL); Brentwood High (math 62% / reading 74%, grade B, #12 of 521 statewide, top 2%, 191 students, 30% FRL) — zoned schools at 23% FRL track the district average.
- Watch-outs: built in 1947 — expect roof / HVAC / electrical / plumbing capex.
- Market conditions: Rents rising (+1.5%/yr); 128 active listings in the ZIP; 8 comparable units currently listed for rent nearby; rentals leasing fast (median 2d on market — plan ~1-2 weeks tenant-placement turnaround); solid renter incomes; 920 units permitted in St. Louis County in 2024 (250 in 5+ unit buildings).
- 7 sale attempts since 10y ago with the ask held roughly flat each time — persistent listings suggest the price (not the market) is what's stuck; bring a comps-based counter.
- Climate carrying-cost: extreme-heat days projected 7→21/yr by 2055 (HVAC capex compounding) — expect insurance premiums to compound above CPI over the hold.
- Cap rate 4.7% vs local median 3.6% in Richmond Heights — meaningfully above typical; check what's discounted (condition, days-on-market, listing class) to confirm the premium yield is real.
- This rent runs 39% of the median local income ($104k/yr) — at the standard rent-burdened threshold; future hikes will face affordability resistance.
Questions for listing agent
- What do current leases actually rent for vs. the listed asking? Can we see a recent rent roll and the last 12 months of T-12 income?
- It's been on market 49 days. Have you received any prior offers? Is the seller open to a 36% concession, seller financing, or rate buy-down credit?
- Built in 1947 — when were the roof, HVAC, electrical panel, plumbing, and water heater last replaced?
- What does the HOA fee cover, when was the last increase, and are there any pending special assessments or reserve-fund shortfalls?
- Is there a deadline driving the sale (1031 exchange, divorce, estate, relocation)? That informs how much negotiation room exists.
- Schools are B-rated — typically a magnet for longer-tenancy family renters. What's the average tenant stay here, and is there a school-zone premium baked into asking?
- Crime grade is F in this area — have there been break-ins, vandalism, or insurance claims at this property in the last 3 years? What carrier currently insures it and at what premium?
- The area grade is low — what's the realistic commute time and amenity access for the typical tenant pool here? Any planned neighborhood developments (good or bad) we should know about?
CashFlowRE · CFR-R5K9K8BAYPZQT0
· Data 1 day ago
cashflowre.app · 2026-05-29