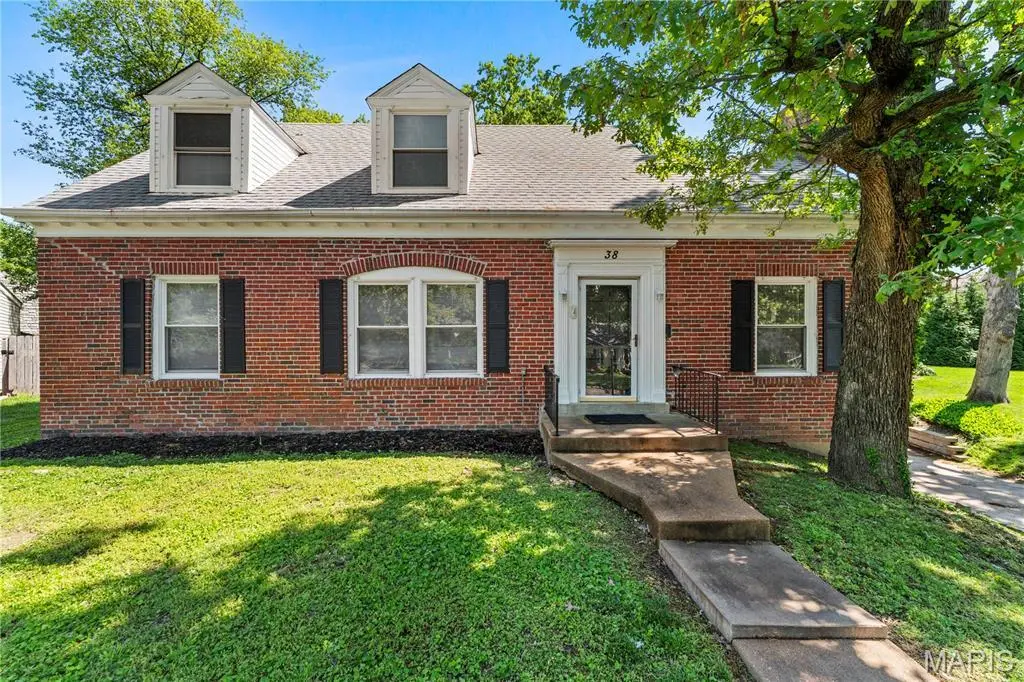
38 Chafford Woods · Richmond Heights, MO
Flood risk 1/10 · Minimal
- FEMA flood zone
- X (unshaded)
- Chance of flooding over 30 yrs
- 0.0%
- Est. flood insurance / yr
- $473 – $860
Fire risk 1/10 · Minimal
- Est. fire insurance / yr
- $1,054 – $1,958
Heat risk 5/10 · Moderate
- Hot days now (above 107°F)
- 7 days/yr
- Hot days in 30 yrs
- 21 days/yr
Wind risk 2/10 · Minimal
- Chance of severe wind over 30 yrs
- 1.0%
Air-quality risk 3/10 · Minor
- Unhealthy air days now
- 2 days/yr
- Unhealthy air days in 30 yrs
- 4 days/yr
Risk factors via First Street. Map © Google.
Why this score? — see what drove the D grade
The composite is a weighted blend of 9 inputs, each scored 0–100. Each bar is that input's sub-score; the figure is the points it added to the 100-point composite (weight × sub-score).
- ARV discount +15.0/15.0
- Cash flow +7.2/30.0
- Schools +5.8/10.0
- Livability +4.2/5.0
- Rent growth +2.9/5.0
- Condition / age +2.5/5.0
- 1% rule +1.4/10.0
- DSCR +1.4/10.0
- Appreciation +0.0/10.0
$519,900
🖨 Deal sheet 📄 Offer letter ✓ Due diligence
Listing remarks
Tucked away in the charming neighborhood of Chafford Woods, this spacious brick two-story offers the kind of space and lot size that are getting harder and harder to find in Brentwood Schools at this price point. With 5 bedrooms, multiple living areas, and an absolutely huge backyard, there’s room to truly spread out while still feeling warm and inviting. The street feels surprisingly tucked away while still being minutes from parks, restaurants, shopping, Clayton, and highway access, offering a quiet neighborhood feel right in the middle of everything. Inside, the layout is flexible, functional, and bright, with connected living spaces that feel both open and comfortable. One of the
Key facts
- 0.38 acre lot
- Garage
- Built 1947
Property features AI
Finance
- HOA & community: Member of Chafford Woods HOA; Annual association fee of $300 covering parking/road maintenance and snow removal
Exterior
- Parking: Attached garage (1-car) with garage door opener; Off-street parking
- Utilities: Public water; Public sewer; Electric service by Ameren; Electricity connected; Natural gas connected; Water and sewer connected
- Home design: Single-family residence; One and one-half story
- Construction: Brick construction; Architectural shingle roof; Block foundation; Has basement (unfinished)
- Exterior features: Back yard; Partially fenced back yard
Interior
- Kitchen: Stainless steel appliances; Dishwasher; Microwave; Gas range; Refrigerator
- Bedrooms: 5 bedrooms total — 2 on the main level, 3 on the upper level
- Bathrooms: 2 full bathrooms total — 1 full on the main level, 1 full on the upper level; Basement roughed-in bathroom (unfinished basement)
- Heating & cooling: Forced air heating; Central air conditioning
- Interior features: Ceiling fans; Crown molding; Granite counters; Pantry; Decorative fireplace (1)
- Laundry & utility: Laundry located on the lower level
Neighborhood map
What this means for you Summary
Snapshot
- This is a 4-bed/2.0-bath single-family listed at $520k.
Deal economics
- At list price, monthly cash flow is $-705 ($-8k/yr) — negative.
- To cash-flow at today's rent, offer at most $395k (24.0% below list).
- To meet the 1% rule (rent ≥ 1% of price), the offer needs to be $335k (35.5% below list).
- Recommended offer: $335k (35.5% below list) — sets the bar for 1% rule.
- Cap rate 4.7% vs local median 3.6% in Richmond Heights — meaningfully above typical; check what's discounted (condition, days-on-market, listing class) to confirm the premium yield is real.
Location & tenants
- Location reads 84/100 on livability (#4 in MO, #652 nationally) — a professional / high-income tenant draw. Strengths: amenities A+, commute A+, employment A+; Watch: crime F.
- Brentwood (suburban): math 65% / reading 66% proficiency, ranked #4 of 324 in MO (top 1%) — acceptable for families but not a draw, mixed tenant base, ~2y average lease; only 18% free/reduced lunch — higher-income household profile.
- Zoned schools: Mcgrath Elem. (math 67% / reading 67%, grade B+, #46 of 1,115 statewide, top 5%, 195 students, 16% FRL); Brentwood High (math 62% / reading 74%, grade B, #12 of 521 statewide, top 2%, 191 students, 30% FRL) — zoned schools at 23% FRL track the district average.
- Market conditions: Rents rising (+1.5%/yr); 128 active listings in the ZIP; 8 comparable units currently listed for rent nearby; rentals leasing fast (median 2d on market — plan ~1-2 weeks tenant-placement turnaround); solid renter incomes; 920 units permitted in St. Louis County in 2024 (250 in 5+ unit buildings).
- This rent runs 39% of the median local income ($104k/yr) — at the standard rent-burdened threshold; future hikes will face affordability resistance.
Forward outlook
- Local home prices are declining (-3.0%/yr); year-one equity from $4k of loan paydown is wiped out by about $16k of value loss. Plan a longer hold.
Negotiation context
- It's been on market 49 days — a 3% lower offer ($504k) is reasonable based on typical stale-listing flexibility.
- 7 sale attempts since 10y ago with the ask held roughly flat each time — persistent listings suggest the price (not the market) is what's stuck; bring a comps-based counter.
Risks & watch-outs
- Watch-outs: built in 1947 — expect roof / HVAC / electrical / plumbing capex.
- Climate carrying-cost: extreme-heat days projected 7→21/yr by 2055 (HVAC capex compounding) — expect insurance premiums to compound above CPI over the hold.
Questions for the listing agent
- What do current leases actually rent for vs. the listed asking? Can we see a recent rent roll and the last 12 months of T-12 income?
- It's been on market 49 days. Have you received any prior offers? Is the seller open to a 36% concession, seller financing, or rate buy-down credit?
- Built in 1947 — when were the roof, HVAC, electrical panel, plumbing, and water heater last replaced?
- What does the HOA fee cover, when was the last increase, and are there any pending special assessments or reserve-fund shortfalls?
- Is there a deadline driving the sale (1031 exchange, divorce, estate, relocation)? That informs how much negotiation room exists.
- Schools are B-rated — typically a magnet for longer-tenancy family renters. What's the average tenant stay here, and is there a school-zone premium baked into asking?
- Crime grade is F in this area — have there been break-ins, vandalism, or insurance claims at this property in the last 3 years? What carrier currently insures it and at what premium?
- The area grade is low — what's the realistic commute time and amenity access for the typical tenant pool here? Any planned neighborhood developments (good or bad) we should know about?
- What's the average days-on-market for RENTAL listings here right now (not sales)? A rising rental-DOM trend means longer vacancies and softer asking-rent achievability than the comps imply.
- What's the recent tenant-quality profile in this submarket — average credit score on applications, eviction rate, late-payment / NSF rate, and stable-employment percentage? A property-management company in the area should have these aggregated.
- How much new for-sale + rental construction is in the pipeline within 1–3 miles? Heavy new supply typically softens prices + rents 12–24 months out; constrained supply supports both.
Investment metrics
- 1% rule
- 0.64% ✗
- Cap rate
- 4.67%
- Cash-on-cash
- -5.81%
- DSCR
- 0.74
- GRM
- 12.9
CMA / ARV
- ARV (median comp)
- $751,220
- List price
- $519,900
- Delta
- -30.79%
- Verdict
- UNDERPRICED
- Comps
- 20 within 1.0 mi
Show comp detail 12 sales within ~0.75 mi
| Address | Dist | Beds/Ba | Sqft | Sold | Price | $/sf | Match |
|---|---|---|---|---|---|---|---|
| 67 Chafford Woods | 0.10mi | 4/2.0 | 2,152 (+0%) | 11mo | $547,900 | $255 | 86 |
| 83 Chafford Woods | 0.13mi | 4/3.0 | 2,034 (-5%) | 0mo | $483,000 | $237 | 81 |
| 9063 Monmouth Dr | 0.26mi | 3/2.0 (-1) | 2,079 (-3%) | 8mo | $525,000 | $253 | 71 |
| 1923 Parkridge Ave | 0.47mi | 3/2.5 (-1) | 2,030 (-5%) | 6mo | $560,000 | $276 | 57 |
| 9007 Lawn Ave | 0.52mi | 4/2.0 | 1,893 (-12%) | 0mo | $525,000 | $277 | 56 |
| 8835 Lawn Ave | 0.58mi | 3/2.5 (-1) | 2,048 (-4%) | 6mo | $449,000 | $219 | 54 |
| 9041 Saranac Dr | 0.20mi | 3/3.0 (-1) | 1,850 (-14%) | 8mo | $599,000 | $324 | 52 |
| 8823 Pine Ave | 0.64mi | 4/2.0 | 2,000 (-7%) | 11mo | $410,000 | $205 | 49 |
| 9007 Lawn Ave | 0.52mi | 3/2.0 (-1) | 1,893 (-12%) | 4mo | $250,000 | $132 | 48 |
| 8921 Lawn Ave | 0.55mi | 4/2.5 | 2,383 (+11%) | 10mo | $725,000 | $304 | 46 |
| 8900 Moritz Ave | 0.70mi | 3/2.0 (-1) | 1,876 (-12%) | 2mo | $409,900 | $218 | 40 |
| 9425 White Ave | 0.73mi | 3/2.5 (-1) | 1,896 (-12%) | 3mo | $549,900 | $290 | 37 |
Match score weights: distance 35% · size 25% · config 20% · recency 20%. Top-matched comps best support the ARV.
Projected returns pro-forma
-3.0% appreciation · 1.49% rent growth · sell at horizon
- IRR
- -27.8%
- Equity multiple
- 0.08×
- Total profit
- $-134,261
- Equity at exit
- $77,519
- IRR
- -32.6%
- Equity multiple
- -0.34×
- Total profit
- $-195,094
- Equity at exit
- $44,951
Cash invested: $145,572 (down + closing). Projections, not guarantees.
Landlord ↔ Tenant lean methodology
- Overall (STATE)
- 81 Strongly Landlord-Friendly
- State Missouri
- 81 Strongly Landlord-Friendly · R+10
- County
- — inherits STATE
- City
- — inherits STATE
ZIP-level market 63144
- Rents YoY
- 1.5%
- Active inventory
- 128
- Price-to-rent
- 12.9×
Monthly cashflow live
- Estimated rent
- $3,352 high interval (Pro) →
- Mortgage (P&I)
- −$2,726
- Tax from tax record
- −$385 /mo · $4,616/yr
- Insurance
- −$217
- HOA
- −$25
- Vacancy / Maint / Mgmt
- −$704
- Net cashflow
- $-705
Break-even live
UW: 25.0% down · 7.5% · 30yr · 1.5% tax · 5.0% vac · 8.0% maint · 8.0% mgmt
Financing live
Cash to close
- Down payment
- $129,975
- Closing costs
- $15,597
- Reserves months
- —
- Total cash needed
- —
Loan-product check · same deal, 3 products live
Conventional
25% down · 7.5% · 30yr
- Down + closing
- —
- Monthly P&I
- —
- Monthly cashflow
- —
- DSCR
- —
- Eligible?
- —
Personal DTI + credit; lowest rate.
DSCR
20% down · 8.5% · 30yr
- Down + closing
- —
- Monthly P&I
- —
- Monthly cashflow
- —
- DSCR
- —
- Eligible?
- —
No personal income docs; deal must DSCR.
Hard money
10% down · 12.0% · 12mo
- Down + closing
- —
- Monthly P&I
- —
- Monthly cashflow
- —
- DSCR
- —
- Eligible?
- —
Short-term bridge; refi at stabilization.
Rent comps 8 comps
| Address | Beds | Baths | Sqft | Rent | $/sqft | DOM | Units | Dist |
|---|---|---|---|---|---|---|---|---|
| 8937 Eager Rd Saint Louis, MO | 4.0 | 3.5 | 2515 | $4,500 | $1.79 | 1d | 1 | 0.27mi |
| 9035 W Swan Cir Saint Louis, MO | 3.0 | 1.5 | 1450 | $2,400 | $1.66 | 10d | 1 | 0.40mi |
| 8408 Louwen Dr Saint Louis, MO | 3.0 | 2.0 | 1656 | $3,100 | $1.87 | 1d | 1 | 0.65mi |
| 1800 S Brentwood Blvd Saint Louis, MO | 1.0–3.0 | 1.0–2.0 | 1164 | $2,720 | $2.34 | 1d | 19 | 0.68mi |
| 8014 Townes Way Saint Louis, MO | 4.0 | 3.5 | 2244 | $3,500 | $1.56 | 19d | 1 | 0.79mi |
| 937 S Bemiston Ave Clayton, MO | 3.0 | 2.5 | 2706 | $6,250 | $2.31 | 1d | 1 | 1.08mi |
| 7574 York Dr Clayton, MO | 3.0 | 2.0 | 1900 | $2,975 | $1.57 | 7d | 1 | 1.34mi |
| 7536 Parkdale Ave Saint Louis, MO | 3.0 | 2.0 | 1500 | $2,000 | $1.33 | 1d | 1 | 1.50mi |
HOA detail
- Monthly dues
- $25 · $300/yr
Listing history 32 events
-
2026-06-19price $519,900 Active 49 DOM
-
2026-06-18days on market $522,900 Active 49 DOM
-
2026-06-17days on market $522,900 Active 48 DOM
-
2026-06-16days on market $522,900 Active 47 DOM
-
2026-06-15days on market $522,900 Active 46 DOM
-
2026-06-13days on market $522,900 Active 44 DOM
-
2026-06-13days on market $522,900 Active 43 DOM
-
2026-06-09days on market $522,900 Active 40 DOM
-
2026-06-08days on market $522,900 Active 39 DOM
-
2026-06-07pricedays on market $522,900 Active 38 DOM
-
2026-06-03days on market $523,900 Active 34 DOM
-
2026-06-02days on market $523,900 Active 33 DOM
-
2026-06-01days on market $523,900 Active 32 DOM
-
2026-05-31days on market $523,900 Active 31 DOM
-
2026-05-14price $524,900 1294-char remark
-
2026-04-30$530,000 Active 1294-char remark
-
2026-04-28historical $530,000 1294-char remark
-
2023-08-13historical
-
2023-08-03$449,900 Active
-
2023-07-29historical
-
2023-06-05status Active
-
2023-06-02historical
-
2023-01-05status Active
-
2023-01-03historical
-
2022-08-08$449,900 Active
-
2020-08-07soldstatus Closed
-
2020-07-21status Pending
-
2020-07-17$275,000 Active
-
2016-09-23soldstatus Closed
-
2016-08-26status Pending
-
2016-08-19$109,900 Active
-
1991-09-18soldstatus
ⓘ Source: listings_history table (triggers on properties + properties_extension) + one-shot
backfill from property_details.listing_events for pre-trigger history.
Tax reassessment forecast MO · Resets to sale price
- Current annual tax
- $4,616 · $385/mo
- Projected year-2 tax
- $5,043 · $420/mo
- Expected delta
- +$427/yr (+$36/mo · 9.3%)
ⓘ Screening estimate from a state-policy table — verify with the county assessor before closing.
Climate risk First Street
- Flood 1/10 Low FEMA zone X (unshaded) · 0% chance over 30 yrs
- Wildfire 1/10 Low
- Heat 5/10 Major 7 d/yr ≥107°F today · 21 d/yr by 30 yrs out
- Wind 2/10 Low 100% chance of damaging wind over 30 yrs
- Air quality 3/10 Moderate 2 unhealthy d/yr today · 4 by 30 yrs out
Nearby sold comps map
Loading sold comps map…
Walkable amenities ~0.75 mi
Loading nearby amenities…
Taxation est. · year 1
- Rental income
- $40,218
- − Mortgage interest
- −$29,122
- − Property taxes
- −$4,616
- − Insurance
- −$2,600
- − Repairs & maintenance
- −$3,217
- − Management
- −$3,217
- − HOA
- −$300
- − Depreciation
- −$15,124
- Taxable loss
- −$17,979
- Est. tax savings @ 24.0%
- +$4,315
- After-tax cash flow
- $-4,145/yr
For passive investors: Depreciation is non-cash, so a rental often shows a tax loss while cash-flowing — sheltering income. Rental losses are passive: they offset passive income freely, and up to $25,000/yr can offset ordinary (W-2) income if you actively participate and your MAGI is under $100k (phasing out to $0 by $150k); unused losses carry forward. On sale, claimed depreciation is recaptured at up to 25%, and gains may owe capital-gains tax (a 1031 exchange can defer both). Figures are a year-1 estimate at your 24.0% rate — not tax advice; consult a CPA.
Schools (NCES district)
- District
- Brentwood
- NCES district ID
- 2905880
- Math proficiency
- 65% ▼ -3.00%
- Reading proficiency
- 66% ▼ -1.00%
- Median HH income
- $69,522
- Composite
- 57.51/100
- National rank
- #1069
- State rank
- #4 of 324 in MO
Livability — Richmond Heights
- Score
- 84/100
- State rank
- #4
- US rank
- #652
Category grades
Schools grade is shown separately in the Schools card above.
Census & demographics
- Census place
- Richmond Heights, MO
- County
- Saint Louis County · 888,823 people
- City population
- 9,261
- Metro
- St. Louis, MO-IL
- Population (ZIP)
- 9,505
- Household income
- $104,438
- Rent vs Own
- Severe rent burden
- 310.0
Population outlook (St. Louis County) Hauer SSP2
- Today (2025)
- 1,025,227 people
- By 2030
- 1,028,023 · +0.3%
- By 2040
- 1,020,940 · -0.4%
- By 2050
- 1,007,280 · -1.8%
- By 2075
- 987,277 · -3.7%
- By 2100
- 921,984 · -10.1%
Race, ethnicity, and origin ACS 2023
- Neighborhood character
- Predominantly White (78%)
- Race & ethnicity
- White 78% Two or more races 10% Asian 7% Black 5% Hispanic / Latino 2%
- Common ancestry
- Romanian 4% Italian 3% Slovak 2%
- Foreign-born
- 11% · China, Canada, South Korea
- Languages at home
- 91% English-only · Other Asian/Pacific 2% Spanish 2% Russian/Polish/Slavic 1%
Political lean MEDSL · St. Louis
- 2024 margin
- Strong D (+23.4) · D 60.8% · R 37.4% · Other 1.7%
- 2008→2024 swing
- +3.5pp toward D · 2008: 19.9pp · 2024: 23.4pp
- All cycles
- 2024: D+23.4 2020: D+24.0 2016: D+16.2 2012: D+13.7 2008: D+19.9
Not yet ingested
- Civics
- —
Market trends
- HPI YoY
- ▼ -411.33%
- Current HPI
- 207.0145
- Rent YoY
- ▲ 1.49%
- Metro
- St. Louis, MO-IL
- State GDP YoY
- ▲ 1.84%
- F500 in state
- 20
Industry mix (Fortune 500 HQ in MO)
| Industry | F500 HQs | Revenue |
|---|---|---|
| Healthcare | 1 | $163B |
|
||
| Insurance | 1 | $21B |
|
||
| Industrial Technology | 1 | $17B |
|
||
| Retail | 1 | $16B |
|
||
| Industrial Distribution | 1 | $10B |
|
||
| Utilities | 1 | $9B |
|
||
Price history
+373.1% since first listed21 events — show timeline
- 2026-06-18 Price Changed $519,900 MARIS as Distributed by MLS Grid
- 2026-06-04 Price Changed $522,900 MARIS as Distributed by MLS Grid
- 2026-05-26 Price Changed $523,900 MARIS as Distributed by MLS Grid
- 2026-05-14 Price Changed $524,900 MARIS as Distributed by MLS Grid
- 2026-04-30 Listed $530,000 MARIS as Distributed by MLS Grid
- 2026-04-28 Coming Soon $530,000 MARIS as Distributed by MLS Grid
- 2023-08-13 Delisted — MARIS as Distributed by MLS Grid
- 2023-08-03 Listed $449,900 MARIS as Distributed by MLS Grid
- 2023-07-29 Delisted — MARIS as Distributed by MLS Grid
- 2023-06-05 Relisted — MARIS as Distributed by MLS Grid
- 2023-06-02 Delisted — MARIS as Distributed by MLS Grid
- 2023-01-05 Relisted — MARIS as Distributed by MLS Grid
- 2023-01-03 Delisted — MARIS as Distributed by MLS Grid
- 2022-08-08 Listed $449,900 MARIS as Distributed by MLS Grid
- 2020-08-07 Sold (MLS) — MARIS as Distributed by MLS Grid
- 2020-07-21 Pending — MARIS as Distributed by MLS Grid
- 2020-07-17 Listed $275,000 MARIS as Distributed by MLS Grid
- 2016-09-23 Sold (MLS) — MARIS as Distributed by MLS Grid
- 2016-08-26 Pending — MARIS as Distributed by MLS Grid
- 2016-08-19 Listed $109,900 MARIS as Distributed by MLS Grid
- 1991-09-18 Sold (Public Records) — Public Records
Property tax history
+0.2%/yrLatest (2022): $4,616 · +0.9% YoY. Source: county tax records.
Cash-flow waterfall
monthlySold comps — $/sqft
last 12 mo · ≤1 miLoading sold comps…