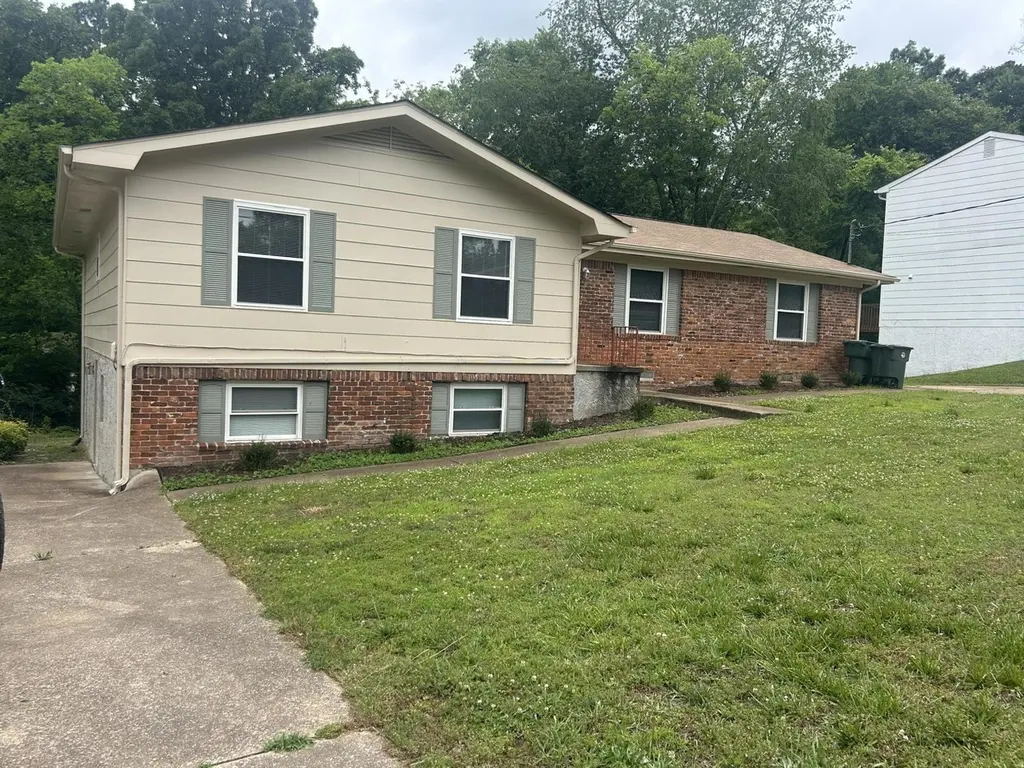
5758 Taggart Dr
Chattanooga, TN 37343
$389,000F
6 bd · 10.0 ba ·
2,872 sqft ·
Built 1970
· MultiFamily
· Active
· 28 DOM
Cashflow @ list (25.0% down · 7.5%)
Estimated rent
$2,135/mo
Mortgage (P&I)
−$2,040
Tax + insurance
−$278
HOA
−$0
Vac / Maint / Mgmt
−$448
Net cashflow
$-632/mo
Annual
$-7,580/yr
Cap rate
4.34%
Cash-on-cash
-6.96%
DSCR
0.69
1% rule
0.55%
Cash to close
$108,920
Investor read
- This is a 6-bed/10.0-bath multifamily listed at $389k.
- At list price, monthly cash flow is $-632 ($-8k/yr) — negative.
- To cash-flow at today's rent, offer at most $277k (28.7% below list).
- To meet the 1% rule (rent ≥ 1% of price), the offer needs to be $214k (45.1% below list).
- It's been on market 28 days — a 2% lower offer ($383k) is reasonable based on typical stale-listing flexibility.
- Recommended offer: $214k (45.1% below list) — sets the bar for 1% rule.
- Local home prices are declining (-3.0%/yr); year-one equity from $3k of loan paydown is wiped out by about $12k of value loss. Plan a longer hold.
- Location reads 78/100 on livability (#3 in TN, #2,582 nationally) — a middle-class / working-renter tenant base. Strengths: amenities A+, commute A+, cost of living A+; Watch: employment D+, crime F.
- Hamilton County (urban): math 31% / reading 31% proficiency, ranked #42 of 139 in TN (top 30%) — families likely to look elsewhere, expect single-tenant / working-renter base with shorter leases.
- Zoned schools: Hixson Elementary (math 24% / reading 20%, grade F, #601 of 952 statewide, top 66%, 402 students, 0% FRL); Hixson Middle School (math 27% / reading 20%, grade F, #162 of 333 statewide, top 50%, 607 students, 0% FRL); Hixson High School (math 22% / reading 32%, grade F, #104 of 332 statewide, top 33%, 935 students, 0% FRL) — zoned schools average 0% FRL vs 52% district-wide (52 pts lower); this property's tenant base skews higher-income than the district average.
- Market conditions: Rents rising (+2.4%/yr); 459 active listings in the ZIP; solid renter incomes; 2,133 units permitted in Hamilton County in 2024 (405 in 5+ unit buildings).
- Hamilton County population projected at +23% by 2050 — long-run rental-demand tailwind backs the buy-and-hold thesis.
- Climate carrying-cost: extreme-heat days projected 8→21/yr by 2055 (HVAC capex compounding) — expect insurance premiums to compound above CPI over the hold.
- Cap rate 4.3% vs local median 3.4% in Chattanooga — meaningfully above typical; check what's discounted (condition, days-on-market, listing class) to confirm the premium yield is real.
- This rent runs 31% of the median local income ($82k/yr) — at the standard rent-burdened threshold; future hikes will face affordability resistance.
Questions for listing agent
- What do current leases actually rent for vs. the listed asking? Can we see a recent rent roll and the last 12 months of T-12 income?
- Built in 1970 — when were the roof, HVAC, electrical panel, plumbing, and water heater last replaced?
- Is there a deadline driving the sale (1031 exchange, divorce, estate, relocation)? That informs how much negotiation room exists.
- Schools are F-rated, which usually means shorter tenancies and higher turnover. Who's the typical renter profile here, and what's been the actual vacancy rate?
- Crime grade is F in this area — have there been break-ins, vandalism, or insurance claims at this property in the last 3 years? What carrier currently insures it and at what premium?
- The area grade is low — what's the realistic commute time and amenity access for the typical tenant pool here? Any planned neighborhood developments (good or bad) we should know about?
- What's the average days-on-market for RENTAL listings here right now (not sales)? A rising rental-DOM trend means longer vacancies and softer asking-rent achievability than the comps imply.
- What's the recent tenant-quality profile in this submarket — average credit score on applications, eviction rate, late-payment / NSF rate, and stable-employment percentage? A property-management company in the area should have these aggregated.
CashFlowRE · CFR-R6CWHNCJR4Z5D0
· Data 2 days ago
cashflowre.app · 2026-05-29