 Multi-family
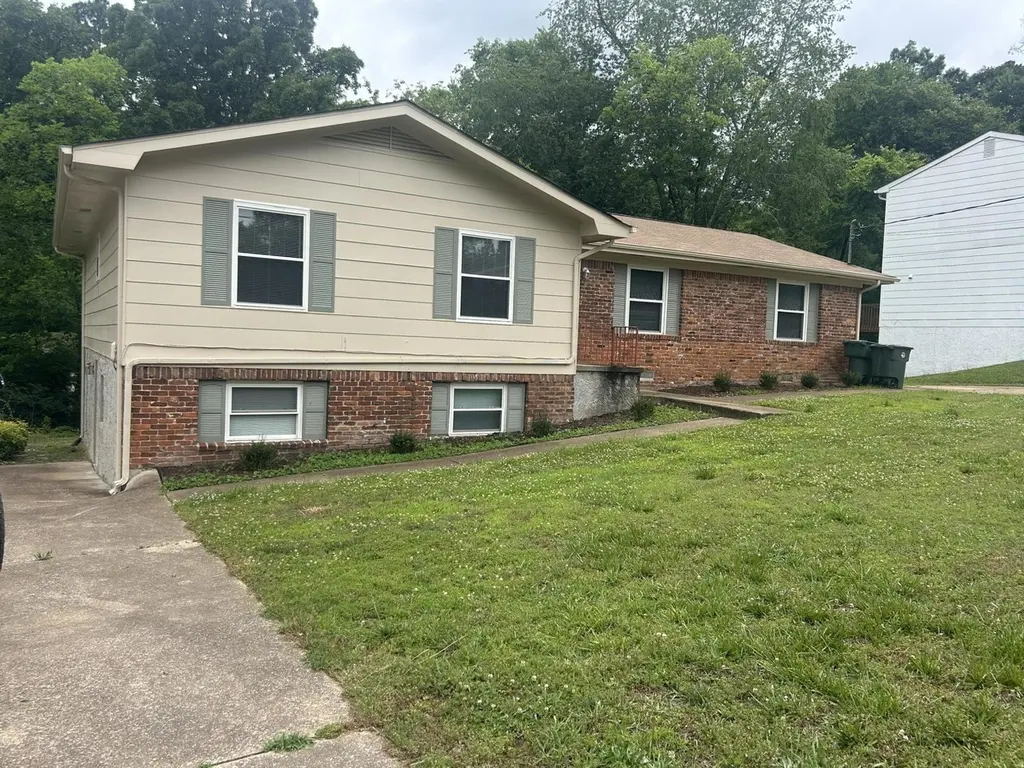
5758 Taggart Dr · Chattanooga, TN
Flood risk 1/10 · Minimal
- FEMA flood zone
- X (unshaded)
- Chance of flooding over 30 yrs
- 0.0%
- Est. flood insurance / yr
- $507 – $1,088
Fire risk 1/10 · Minimal
- Est. fire insurance / yr
- $949 – $1,763
Heat risk 5/10 · Moderate
- Hot days now (above 105°F)
- 8 days/yr
- Hot days in 30 yrs
- 21 days/yr
Wind risk 4/10 · Minor
- Chance of severe wind over 30 yrs
- 10.0%
Air-quality risk 3/10 · Minor
- Unhealthy air days now
- 2 days/yr
- Unhealthy air days in 30 yrs
- 3 days/yr
Risk factors via First Street. Map © Google.
Why this score? — see what drove the F grade
The composite is a weighted blend of 9 inputs, each scored 0–100. Each bar is that input's sub-score; the figure is the points it added to the 100-point composite (weight × sub-score).
- ARV discount +7.5/15.0
- Cash flow +6.6/30.0
- Livability +3.9/5.0
- Rent growth +3.1/5.0
- Schools +2.7/10.0
- Condition / age +2.5/5.0
- DSCR +0.9/10.0
- 1% rule +0.5/10.0
- Appreciation +0.0/10.0
$389,000
🖨 Deal sheet 📄 Offer letter ✓ Due diligence
Multi-family units
County records classify this as Multi-Family (2-4 Unit). Listing-text estimate: 1 unit. estimate disagrees with records
Listing remarks
Multigenerational living, investment opportunity, or live in one side and rent the other. After successfully renting this property for decades, the seller decided to complete several upgrades and a ''freshening'' of the interior and is now ready to pass on to a new owner. New exterior paint, roof under 5 years old, and a newer HVAC unit make this a quick money making opportunity. Rentals in that area are currently renting between $1500-$1800/mo for each side. Just off of Hwy 153 ensures an easy commute into Hixson, Chattanooga, Soddy, Red Bank or Sale Creek. Lake Forest boasts duplexes as well as single family homes in a well established neighborhood only minutes from shopping and restauran
Key facts
- New exterior paint
- Newer hvac unit
- 0.29 acre lot
Tags
Property features AI
Finance
- Other: Property used for residential income
- HOA & community: No community amenities listed
Exterior
- Parking: Concrete driveway
- Utilities: Public water; Public sewer; Electricity connected; Phone available; Sewer connected; Water connected
- Home design: Duplex; Two stories; Updated/remodeled
- Construction: Wood siding; Block and slab foundation; Built as a duplex
- Exterior features: Shingle roof; No pool or spa; No fencing; No patio or porch
Interior
- Kitchen: Free‑standing refrigerator; Free‑standing range; Electric range
- Bedrooms: Unfurnished units
- Flooring: Carpet; Tile; Vinyl
- Bathrooms: 2 full bathrooms; 16 half bathrooms
- Heating & cooling: Central heat; Central air conditioning
- Interior features: Finished basement; Rain gutters
- Laundry & utility: Laundry closet; Laundry room; Electric water heater; Water heater
Neighborhood map
What this means for you Summary
Snapshot
- This is a 6-bed/10.0-bath multifamily listed at $389k.
Deal economics
- At list price, monthly cash flow is $-632 ($-8k/yr) — negative.
- To cash-flow at today's rent, offer at most $277k (28.7% below list).
- To meet the 1% rule (rent ≥ 1% of price), the offer needs to be $214k (45.1% below list).
- Recommended offer: $214k (45.1% below list) — sets the bar for 1% rule.
- Cap rate 4.3% vs local median 3.4% in Chattanooga — meaningfully above typical; check what's discounted (condition, days-on-market, listing class) to confirm the premium yield is real.
Location & tenants
- Location reads 78/100 on livability (#3 in TN, #2,582 nationally) — a middle-class / working-renter tenant base. Strengths: amenities A+, commute A+, cost of living A+; Watch: employment D+, crime F.
- Hamilton County (urban): math 31% / reading 31% proficiency, ranked #42 of 139 in TN (top 30%) — families likely to look elsewhere, expect single-tenant / working-renter base with shorter leases.
- Zoned schools: Hixson Elementary (math 24% / reading 20%, grade F, #601 of 952 statewide, top 66%, 402 students, 0% FRL); Hixson Middle School (math 27% / reading 20%, grade F, #162 of 333 statewide, top 50%, 607 students, 0% FRL); Hixson High School (math 22% / reading 32%, grade F, #104 of 332 statewide, top 33%, 935 students, 0% FRL) — zoned schools average 0% FRL vs 52% district-wide (52 pts lower); this property's tenant base skews higher-income than the district average.
- Market conditions: Rents rising (+2.4%/yr); 459 active listings in the ZIP; solid renter incomes; 2,133 units permitted in Hamilton County in 2024 (405 in 5+ unit buildings).
- This rent runs 31% of the median local income ($82k/yr) — at the standard rent-burdened threshold; future hikes will face affordability resistance.
Forward outlook
- Local home prices are declining (-3.0%/yr); year-one equity from $3k of loan paydown is wiped out by about $12k of value loss. Plan a longer hold.
- Hamilton County population projected at +23% by 2050 — long-run rental-demand tailwind backs the buy-and-hold thesis.
Negotiation context
- It's been on market 28 days — a 2% lower offer ($383k) is reasonable based on typical stale-listing flexibility.
Risks & watch-outs
- Climate carrying-cost: extreme-heat days projected 8→21/yr by 2055 (HVAC capex compounding) — expect insurance premiums to compound above CPI over the hold.
Questions for the listing agent
- What do current leases actually rent for vs. the listed asking? Can we see a recent rent roll and the last 12 months of T-12 income?
- Built in 1970 — when were the roof, HVAC, electrical panel, plumbing, and water heater last replaced?
- Is there a deadline driving the sale (1031 exchange, divorce, estate, relocation)? That informs how much negotiation room exists.
- Schools are F-rated, which usually means shorter tenancies and higher turnover. Who's the typical renter profile here, and what's been the actual vacancy rate?
- Crime grade is F in this area — have there been break-ins, vandalism, or insurance claims at this property in the last 3 years? What carrier currently insures it and at what premium?
- The area grade is low — what's the realistic commute time and amenity access for the typical tenant pool here? Any planned neighborhood developments (good or bad) we should know about?
- What's the average days-on-market for RENTAL listings here right now (not sales)? A rising rental-DOM trend means longer vacancies and softer asking-rent achievability than the comps imply.
- What's the recent tenant-quality profile in this submarket — average credit score on applications, eviction rate, late-payment / NSF rate, and stable-employment percentage? A property-management company in the area should have these aggregated.
- How much new apartment / multifamily construction is in the pipeline within 1–3 miles? Heavy new supply (>2% of stock underway) typically softens rents 12–24 months out; light construction supports rent growth.
Investment metrics
- 1% rule
- 0.55% ✗
- Cap rate
- 4.34%
- Cash-on-cash
- -6.96%
- DSCR
- 0.69
- GRM
- 15.2
CMA / ARV
No comps found within radius.
Projected returns pro-forma
-3.0% appreciation · 2.41% rent growth · sell at horizon
- IRR
- -29.0%
- Equity multiple
- 0.04×
- Total profit
- $-104,723
- Equity at exit
- $58,001
- IRR
- -31.5%
- Equity multiple
- -0.37×
- Total profit
- $-148,899
- Equity at exit
- $33,634
Cash invested: $108,920 (down + closing). Projections, not guarantees.
Landlord ↔ Tenant lean methodology
- Overall (STATE)
- 87 Strongly Landlord-Friendly
- State Tennessee
- 87 Strongly Landlord-Friendly · R+13
- County
- — inherits STATE
- City
- — inherits STATE
ZIP-level market 37343
- Rents YoY
- 2.4%
- Active inventory
- 459
- Price-to-rent
- 15.2×
Monthly cashflow live
- Estimated rent
- $2,135 medium interval (Pro) →
- Mortgage (P&I)
- −$2,040
- Tax from tax record
- −$116 /mo · $1,397/yr
- Insurance
- −$162
- HOA
- −$0
- Vacancy / Maint / Mgmt
- −$448
- Net cashflow
- $-632
Break-even live
UW: 25.0% down · 7.5% · 30yr · 1.5% tax · 5.0% vac · 8.0% maint · 8.0% mgmt
Financing live
Cash to close
- Down payment
- $97,250
- Closing costs
- $11,670
- Reserves months
- —
- Total cash needed
- —
Loan-product check · same deal, 3 products live
Conventional
25% down · 7.5% · 30yr
- Down + closing
- —
- Monthly P&I
- —
- Monthly cashflow
- —
- DSCR
- —
- Eligible?
- —
Personal DTI + credit; lowest rate.
DSCR
20% down · 8.5% · 30yr
- Down + closing
- —
- Monthly P&I
- —
- Monthly cashflow
- —
- DSCR
- —
- Eligible?
- —
No personal income docs; deal must DSCR.
Hard money
10% down · 12.0% · 12mo
- Down + closing
- —
- Monthly P&I
- —
- Monthly cashflow
- —
- DSCR
- —
- Eligible?
- —
Short-term bridge; refi at stabilization.
Listing history 16 events
-
2026-06-18days on market $389,000 Active 28 DOM
-
2026-06-17days on market $389,000 Active 27 DOM
-
2026-06-16days on market $389,000 Active 26 DOM
-
2026-06-15days on market $389,000 Active 25 DOM
-
2026-06-14days on market $389,000 Active 23 DOM
-
2026-06-10days on market $389,000 Active 20 DOM
-
2026-06-09days on market $389,000 Active 19 DOM
-
2026-06-08days on market $389,000 Active 18 DOM
-
2026-06-07days on market $389,000 Active 17 DOM
-
2026-06-05days on market $389,000 Active 14 DOM
-
2026-06-03days on market $389,000 Active 13 DOM
-
2026-06-02days on market $389,000 Active 12 DOM
-
2026-06-01days on market $389,000 Active 11 DOM
-
2026-05-31days on market $389,000 Active 10 DOM
-
2026-05-30days on market $389,000 Active 9 DOM
-
2026-05-20$389,000 Active
ⓘ Source: listings_history table (triggers on properties + properties_extension) + one-shot
backfill from property_details.listing_events for pre-trigger history.
Tax reassessment forecast TN · Resets to sale price
- Current annual tax
- $1,397 · $116/mo
- Projected year-2 tax
- $2,762 · $230/mo
- Expected delta
- +$1,365/yr (+$114/mo · 97.7%)
ⓘ Screening estimate from a state-policy table — verify with the county assessor before closing.
Climate risk First Street
- Flood 1/10 Low FEMA zone X (unshaded) · 0% chance over 30 yrs
- Wildfire 1/10 Low
- Heat 5/10 Major 8 d/yr ≥105°F today · 21 d/yr by 30 yrs out
- Wind 4/10 Moderate 10% chance of damaging wind over 30 yrs
- Air quality 3/10 Moderate 2 unhealthy d/yr today · 3 by 30 yrs out
Nearby sold comps map
Loading sold comps map…
Walkable amenities ~0.75 mi
Loading nearby amenities…
Taxation est. · year 1
- Rental income
- $25,622
- − Mortgage interest
- −$21,790
- − Property taxes
- −$1,397
- − Insurance
- −$1,945
- − Repairs & maintenance
- −$2,050
- − Management
- −$2,050
- − Depreciation
- −$11,316
- Taxable loss
- −$14,926
- Est. tax savings @ 24.0%
- +$3,582
- After-tax cash flow
- $-3,998/yr
For passive investors: Depreciation is non-cash, so a rental often shows a tax loss while cash-flowing — sheltering income. Rental losses are passive: they offset passive income freely, and up to $25,000/yr can offset ordinary (W-2) income if you actively participate and your MAGI is under $100k (phasing out to $0 by $150k); unused losses carry forward. On sale, claimed depreciation is recaptured at up to 25%, and gains may owe capital-gains tax (a 1031 exchange can defer both). Figures are a year-1 estimate at your 24.0% rate — not tax advice; consult a CPA.
Schools (NCES district)
- District
- Hamilton County
- NCES district ID
- 4701590
- Math proficiency
- 31% ▼ -10.00%
- Reading proficiency
- 31% ▼ -3.00%
- Median HH income
- $47,456
- Composite
- 26.8/100
- National rank
- #7122
- State rank
- #42 of 139 in TN
Livability — Chattanooga
- Score
- 78/100
- State rank
- #3
- US rank
- #2582
Category grades
Schools grade is shown separately in the Schools card above.
Census & demographics
- Census place
- Chattanooga, TN
- County
- Hamilton County · 312,777 people
- City population
- 131,999
- Metro
- Chattanooga, TN-GA
- Population (ZIP)
- 45,101
- Household income
- $82,227
- Rent vs Own
- Severe rent burden
- 1152.0
Population outlook (Hamilton County) Hauer SSP2
- Today (2025)
- 393,784 people
- By 2030
- 412,983 · +4.9%
- By 2040
- 449,502 · +14.1%
- By 2050
- 484,341 · +23.0%
- By 2075
- 565,746 · +43.7%
- By 2100
- 618,394 · +57.0%
Race, ethnicity, and origin ACS 2023
- Neighborhood character
- Predominantly White (83%)
- Race & ethnicity
- White 83% Hispanic / Latino 7% Two or more races 6% Black 5% Asian 2%
- Hispanic origin (detail)
- Mexican 4%
- Common ancestry
- Slovak 2% Romanian 2% Lithuanian 2%
- Foreign-born
- 5% · Canada, Vietnam, South Korea
- Languages at home
- 92% English-only · Spanish 5% Other Indo-European 1% Chinese 1%
Political lean MEDSL · Hamilton
- 2024 margin
- R (+13.1) · D 42.7% · R 55.7% · Other 1.6%
- 2008→2024 swing
- -1.2pp toward R · 2008: -11.8pp · 2024: -13.1pp
- All cycles
- 2024: R+13.1 2020: R+9.7 2016: R+16.6 2012: R+14.8 2008: R+11.8
Not yet ingested
- Civics
- —
Market trends
- HPI YoY
- ▼ -324.61%
- Current HPI
- 260.3778
- Rent YoY
- ▲ 2.41%
- Metro
- Chattanooga, TN-GA
- State GDP YoY
- ▲ 2.78%
- F500 in state
- 22
Industry mix (Fortune 500 HQ in TN)
| Industry | F500 HQs | Revenue |
|---|---|---|
| Healthcare | 3 | $91B |
|
||
| Retail | 3 | $72B |
|
||
| Transportation / Logistics | 1 | $88B |
|
||
| Paper / Packaging | 1 | $19B |
|
||
| Insurance | 1 | $13B |
|
||
| Energy | 1 | $12B |
|
||
Price history
1 event — show timeline
- 2026-05-20 Listed $389,000 GCAR
Property tax history
+1.1%/yrLatest (2025): $1,397 · +9.3% YoY. Source: county tax records.
Cash-flow waterfall
monthlySold comps — $/sqft
last 12 mo · ≤1 miLoading sold comps…