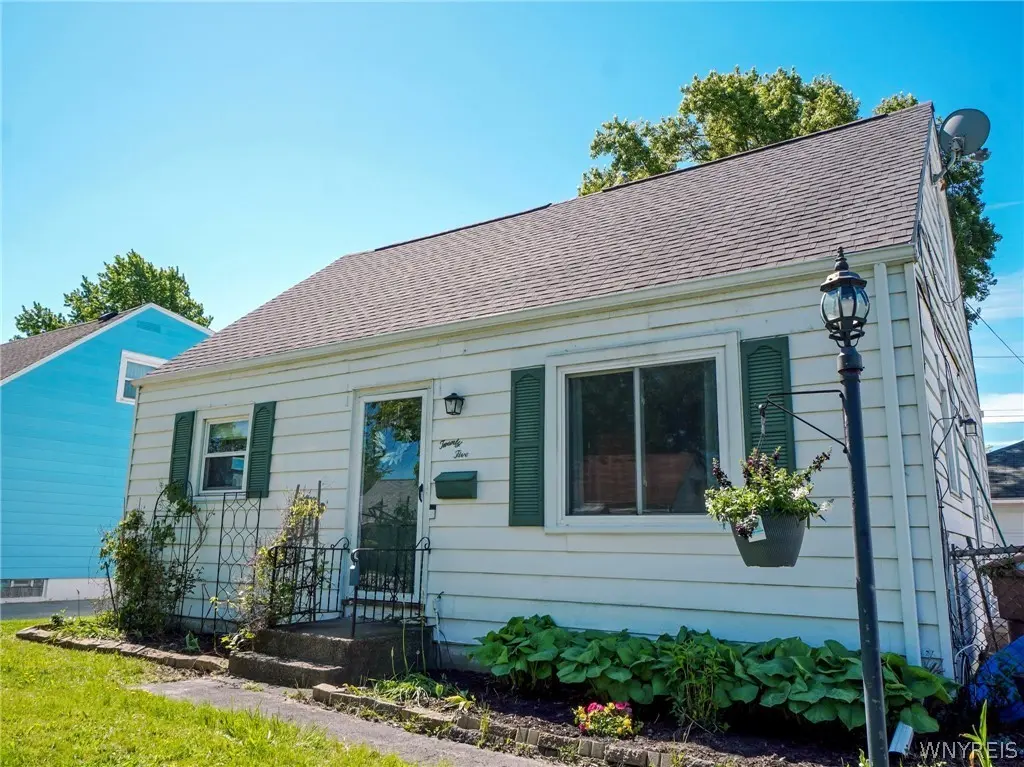
25 Mafalda Dr
Cheektowaga, NY 14215
$179,900B-
4 bd · 1.5 ba ·
1,110 sqft ·
Built 1951
· SingleFamily
· Pending
· 12 DOM
Cashflow @ list (25.0% down · 7.5%)
Estimated rent
$2,396/mo
Mortgage (P&I)
−$943
Tax + insurance
−$523
HOA
−$0
Vac / Maint / Mgmt
−$503
Net cashflow
$426/mo
Annual
$5,117/yr
Cap rate
9.14%
Cash-on-cash
10.16%
DSCR
1.45
1% rule
1.33%
Cash to close
$50,372
Investor read
- This is a 4-bed/1.5-bath single-family listed at $180k.
- At list price, monthly cash flow is $426 ($5k/yr) — positive.
- The deal already cash-flows at list — no discount required.
- Meets the 1% rule at list price ($2k rent vs $180k).
- Only 12 days on market — expect competitive offers; lowballing is unlikely to land.
- Local home prices are declining (-3.0%/yr); year-one equity from $1k of loan paydown is wiped out by about $5k of value loss. Plan a longer hold.
- Location reads 84/100 on livability (#54 in NY, #811 nationally) — a professional / high-income tenant draw. Strengths: commute A+, housing A+, health & safety A+; Watch: crime C-.
- Cleveland Hill Union Free School District (urban): math 42% / reading 46% proficiency, ranked #468 of 590 in NY (top 79%) — families likely to look elsewhere, expect single-tenant / working-renter base with shorter leases.
- Watch-outs: property tax is 3.0% of price; built in 1951 — expect roof / HVAC / electrical / plumbing capex.
- Market conditions: Rents flat; 237 active listings in the ZIP; 3 comparable units currently listed for rent nearby; rentals leasing fast (median 2d on market — plan ~1-2 weeks tenant-placement turnaround); lower-income renter base — watch delinquency; 1,244 units permitted in Erie County in 2024 (563 in 5+ unit buildings).
- 3 sale attempts since 16y ago with the ask held roughly flat each time — persistent listings suggest the price (not the market) is what's stuck; bring a comps-based counter.
- Current owner paid $83k; list at $180k implies a 116% gain — meaningful room to come down on a strong offer.
- Cap rate 9.1% vs local median 3.8% in Cheektowaga — top-decile yield for the area; either an underpriced asset or a hidden risk that comps aren't pricing in. Stress-test before assuming the spread holds.
- At $2,396/mo this rent would consume 64% of the median local household income ($45k/yr) (locally 2873% of renters already pay >50% of income on rent) — very limited rent-growth headroom before tenants either downsize or default.
Questions for listing agent
- Built in 1951 — when were the roof, HVAC, electrical panel, plumbing, and water heater last replaced?
- Property tax is high relative to price — has the assessment been appealed recently, and will the sale trigger a re-assessment?
- Is there a deadline driving the sale (1031 exchange, divorce, estate, relocation)? That informs how much negotiation room exists.
- Schools are B-rated — typically a magnet for longer-tenancy family renters. What's the average tenant stay here, and is there a school-zone premium baked into asking?
- What's the average days-on-market for RENTAL listings here right now (not sales)? A rising rental-DOM trend means longer vacancies and softer asking-rent achievability than the comps imply.
- What's the recent tenant-quality profile in this submarket — average credit score on applications, eviction rate, late-payment / NSF rate, and stable-employment percentage? A property-management company in the area should have these aggregated.
- How much new for-sale + rental construction is in the pipeline within 1–3 miles? Heavy new supply typically softens prices + rents 12–24 months out; constrained supply supports both.
CashFlowRE · CFR-R6R0XM97JEM95P
· Data 1 week ago
cashflowre.app · 2026-05-29