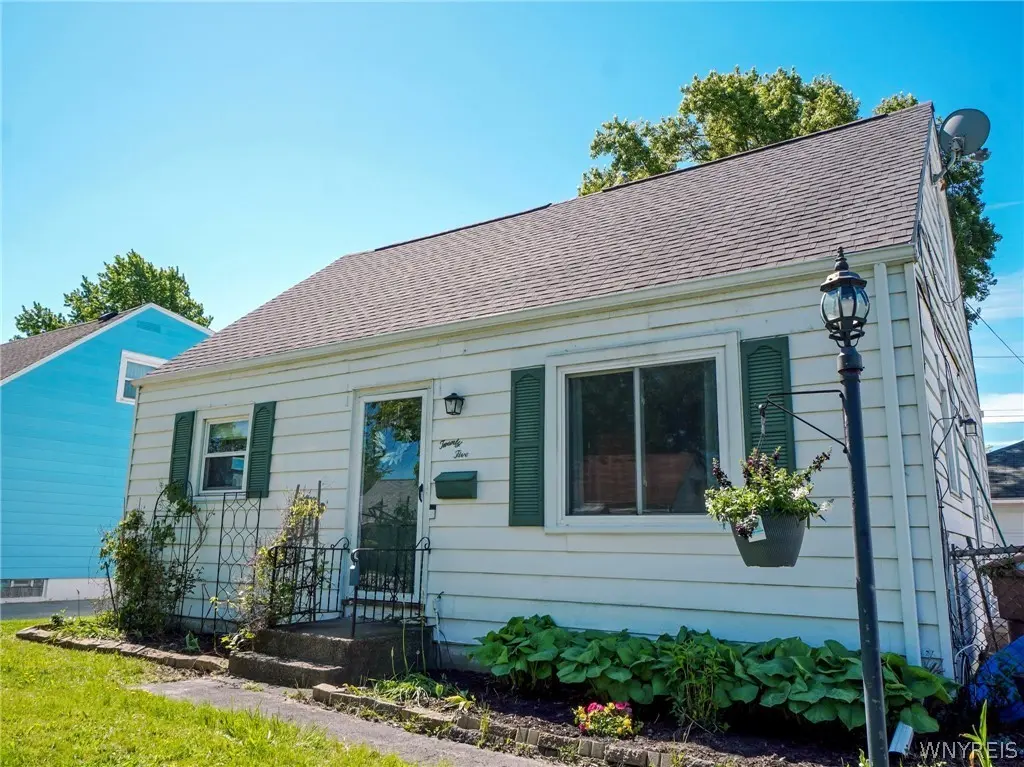
25 Mafalda Dr · Cheektowaga, NY
Flood risk 1/10 · Minimal
- FEMA flood zone
- X (unshaded)
- Chance of flooding over 30 yrs
- 0.0%
- Est. flood insurance / yr
- $473 – $860
Fire risk 1/10 · Minimal
- Est. fire insurance / yr
- $691 – $1,283
Heat risk 2/10 · Minimal
- Hot days now (above 93°F)
- 7 days/yr
- Hot days in 30 yrs
- 15 days/yr
Wind risk 1/10 · Minimal
- Chance of severe wind over 30 yrs
- —
Air-quality risk 3/10 · Minor
- Unhealthy air days now
- 2 days/yr
- Unhealthy air days in 30 yrs
- 3 days/yr
Risk factors via First Street. Map © Google.
Why this score? — see what drove the B- grade
The composite is a weighted blend of 9 inputs, each scored 0–100. Each bar is that input's sub-score; the figure is the points it added to the 100-point composite (weight × sub-score).
- Cash flow +25.6/30.0
- ARV discount +13.5/15.0
- DSCR +8.5/10.0
- 1% rule +8.3/10.0
- Livability +4.2/5.0
- Schools +3.8/10.0
- Rent growth +2.7/5.0
- Condition / age +2.5/5.0
- Appreciation +0.0/10.0
$179,900
🖨 Deal sheet 📄 Offer letter ✓ Due diligence
Listing remarks MLS
Start your home ownership here at 25 Mafalda Dr!! Comfortable & well-maintained 4 bedroom, 1.5 bath Cape Cod home! Roomy oak kitchen allows for excellent cooking potential. Great Living room to keep yourself entertained. Exposed stair case leading up to a Master w/ half bath. Natural woodwork throughout & beautiful hardwood floors. Full basement w/ glass block windows. Built 10x12 addition in 2005 w/ sliding glass doors to deck & fully fenced, deep back yard. 2 car, double door, large detached garage. Newer roof & HWT, '04 New furnace A/C ready.
Key facts
- New hot water tank
- New gutters
- Sunroom
Tags
Property features AI
Exterior
- Parking: Detached garage; 2 garage spaces
- Utilities: Electricity available; Public water (connected); Sewer connected
- Home design: 2-story house; Existing (previously built); City street frontage; Rectangular residential lot near public transit
- Construction: Aluminum siding; Asphalt roof; Poured foundation; Copper and PEX plumbing
- Exterior features: Enclosed porch / porch; Sunroom / Florida room; Fully fenced yard; Blacktop driveway
Interior
- Kitchen: Gas oven and gas range; Range hood; Dishwasher; Refrigerator; Exhaust fan; Eat-in kitchen layout
- Bedrooms: Bedroom 1 (Second floor) — 15 x 10; Bedroom 2 (Second floor) — 15 x 9; Bedroom 3 (First floor) — 11 x 11; Bedroom 4 (First floor) — 11 x 9; Additional room (First floor) — 10 x 10
- Flooring: Carpet; Hardwood; Tile; Vinyl; Varies
- Bathrooms: 1 full bathroom; 1 half bathroom; 1 main-level bathroom
- Heating & cooling: Gas forced-air heat; Central air conditioning
- Interior features: Ceiling fan(s); Eat-in kitchen; Separate/formal living room; Sliding doors / sliding glass door(s); Bedroom on main level; Primary bedroom with bath
- Laundry & utility: Washer and dryer; Laundry located in basement
Neighborhood map
What this means for you Summary
Snapshot
- This is a 4-bed/1.5-bath single-family listed at $180k.
Deal economics
- At list price, monthly cash flow is $426 ($5k/yr) — positive.
- The deal already cash-flows at list — no discount required.
- Meets the 1% rule at list price ($2k rent vs $180k).
- Cap rate 9.1% vs local median 3.8% in Cheektowaga — top-decile yield for the area; either an underpriced asset or a hidden risk that comps aren't pricing in. Stress-test before assuming the spread holds.
Location & tenants
- Location reads 84/100 on livability (#54 in NY, #811 nationally) — a professional / high-income tenant draw. Strengths: commute A+, housing A+, health & safety A+; Watch: crime C-.
- Cleveland Hill Union Free School District (urban): math 42% / reading 46% proficiency, ranked #468 of 590 in NY (top 79%) — families likely to look elsewhere, expect single-tenant / working-renter base with shorter leases.
- Market conditions: Rents flat; 237 active listings in the ZIP; 3 comparable units currently listed for rent nearby; rentals leasing fast (median 2d on market — plan ~1-2 weeks tenant-placement turnaround); lower-income renter base — watch delinquency; 1,244 units permitted in Erie County in 2024 (563 in 5+ unit buildings).
- At $2,396/mo this rent would consume 64% of the median local household income ($45k/yr) (locally 2873% of renters already pay >50% of income on rent) — very limited rent-growth headroom before tenants either downsize or default.
Forward outlook
- Local home prices are declining (-3.0%/yr); year-one equity from $1k of loan paydown is wiped out by about $5k of value loss. Plan a longer hold.
Negotiation context
- Only 12 days on market — expect competitive offers; lowballing is unlikely to land.
- 3 sale attempts since 16y ago with the ask held roughly flat each time — persistent listings suggest the price (not the market) is what's stuck; bring a comps-based counter.
- Current owner paid $83k; list at $180k implies a 116% gain — meaningful room to come down on a strong offer.
Risks & watch-outs
- Watch-outs: property tax is 3.0% of price; built in 1951 — expect roof / HVAC / electrical / plumbing capex.
Questions for the listing agent
- Built in 1951 — when were the roof, HVAC, electrical panel, plumbing, and water heater last replaced?
- Property tax is high relative to price — has the assessment been appealed recently, and will the sale trigger a re-assessment?
- Is there a deadline driving the sale (1031 exchange, divorce, estate, relocation)? That informs how much negotiation room exists.
- Schools are B-rated — typically a magnet for longer-tenancy family renters. What's the average tenant stay here, and is there a school-zone premium baked into asking?
- What's the average days-on-market for RENTAL listings here right now (not sales)? A rising rental-DOM trend means longer vacancies and softer asking-rent achievability than the comps imply.
- What's the recent tenant-quality profile in this submarket — average credit score on applications, eviction rate, late-payment / NSF rate, and stable-employment percentage? A property-management company in the area should have these aggregated.
- How much new for-sale + rental construction is in the pipeline within 1–3 miles? Heavy new supply typically softens prices + rents 12–24 months out; constrained supply supports both.
Investment metrics
- 1% rule
- 1.33% ✓
- Cap rate
- 9.14%
- Cash-on-cash
- 10.16%
- DSCR
- 1.45
- GRM
- 6.3
CMA / ARV
- ARV (on-the-fly)
- $207,570
- Comps found
- 12
Show comp detail 12 sales within ~0.75 mi
| Address | Dist | Beds/Ba | Sqft | Sold | Price | $/sf | Match |
|---|---|---|---|---|---|---|---|
| 105 Mafalda Dr | 0.15mi | 4/1.0 | 1,080 (-3%) | 3mo | $177,500 | $164 | 84 |
| 154 Cleveland Dr | 0.36mi | 3/1.0 (-1) | 1,156 (+4%) | 5mo | $215,900 | $187 | 65 |
| 299 Burke Dr | 0.46mi | 3/1.0 (-1) | 1,100 (-1%) | 6mo | $158,000 | $144 | 65 |
| 695 Mount Vernon Rd | 0.34mi | 3/1.5 (-1) | 1,220 (+10%) | 1mo | $250,000 | $205 | 62 |
| 75 Seton Rd | 0.58mi | 3/1.0 (-1) | 1,134 (+2%) | 1mo | $240,000 | $212 | 62 |
| 19 Allendale Rd | 0.40mi | 4/1.0 | 990 (-11%) | 1mo | $165,000 | $167 | 61 |
| 358 Hastings Ave | 0.63mi | 3/1.0 (-1) | 1,152 (+4%) | 1mo | $128,500 | $112 | 56 |
| 94 Danbury Dr | 0.60mi | 3/1.0 (-1) | 1,170 (+5%) | 4mo | $230,000 | $197 | 53 |
| 120 Beale Ave | 0.74mi | 3/1.0 (-1) | 1,046 (-6%) | 2mo | $245,000 | $234 | 47 |
| 296 Burke Dr | 0.48mi | 3/1.5 (-1) | 1,276 (+15%) | 4mo | $230,000 | $180 | 44 |
| 99 Briarcliff Rd | 0.55mi | 3/1.5 (-1) | 1,275 (+15%) | 3mo | $170,000 | $133 | 42 |
| 155 Seton Rd | 0.75mi | 3/1.5 (-1) | 952 (-14%) | 5mo | $250,000 | $263 | 32 |
Match score weights: distance 35% · size 25% · config 20% · recency 20%. Top-matched comps best support the ARV.
Projected returns pro-forma
-3.0% appreciation · 0.67% rent growth · sell at horizon
- IRR
- -4.0%
- Equity multiple
- 0.85×
- Total profit
- $-7,307
- Equity at exit
- $26,824
- IRR
- 2.5%
- Equity multiple
- 1.16×
- Total profit
- $7,819
- Equity at exit
- $15,554
Cash invested: $50,372 (down + closing). Projections, not guarantees.
Landlord ↔ Tenant lean methodology
- Overall (STATE)
- 15 Strongly Tenant-Friendly
- State New York
- 15 Strongly Tenant-Friendly · D+10
- County
- — inherits STATE
- City
- — inherits STATE
ZIP-level market 14215
- Home prices YoY
- -30.0%
- Rents YoY
- 0.7%
- Active inventory
- 237
- Price-to-rent
- 6.3×
Monthly cashflow live
- Estimated rent
- $2,396 medium interval (Pro) →
- Mortgage (P&I)
- −$943
- Tax from tax record
- −$448 /mo · $5,373/yr
- Insurance
- −$75
- HOA
- −$0
- Vacancy / Maint / Mgmt
- −$503
- Net cashflow
- $426
Break-even live
UW: 25.0% down · 7.5% · 30yr · 1.5% tax · 5.0% vac · 8.0% maint · 8.0% mgmt
Financing live
Cash to close
- Down payment
- $44,975
- Closing costs
- $5,397
- Reserves months
- —
- Total cash needed
- —
Loan-product check · same deal, 3 products live
Conventional
25% down · 7.5% · 30yr
- Down + closing
- —
- Monthly P&I
- —
- Monthly cashflow
- —
- DSCR
- —
- Eligible?
- —
Personal DTI + credit; lowest rate.
DSCR
20% down · 8.5% · 30yr
- Down + closing
- —
- Monthly P&I
- —
- Monthly cashflow
- —
- DSCR
- —
- Eligible?
- —
No personal income docs; deal must DSCR.
Hard money
10% down · 12.0% · 12mo
- Down + closing
- —
- Monthly P&I
- —
- Monthly cashflow
- —
- DSCR
- —
- Eligible?
- —
Short-term bridge; refi at stabilization.
Rent comps 3 comps
| Address | Beds | Baths | Sqft | Rent | $/sqft | DOM | Units | Dist |
|---|---|---|---|---|---|---|---|---|
| 44 Aurora Dr Buffalo, NY | 3.0 | 1.0 | 1272 | $3,300 | $2.59 | 1d | 1 | 0.27mi |
| 189 Westminster Ave Buffalo, NY | 4.0 | 1.5 | 1065 | $1,595 | $1.50 | 10d | 1 | 0.87mi |
| 97 Davidson Ave Buffalo, NY | 3.0 | 1.0 | 925 | $1,495 | $1.62 | 1d | 1 | 1.04mi |
Listing history 15 events
-
2026-06-08statusdays on market $179,900 Pending 12 DOM
-
2026-06-07days on market $179,900 Active Under Contract 11 DOM
-
2026-06-05statusdays on market $179,900 Active Under Contract 8 DOM
-
2026-06-03days on market $179,900 Active 7 DOM
-
2026-06-02days on market $179,900 Active 6 DOM
-
2026-06-01days on market $179,900 Active 5 DOM
-
2026-05-31days on market $179,900 Active 4 DOM
-
2026-05-27$179,900 Active
-
2013-06-27soldstatus $83,300
-
2013-06-27soldstatus $78,302
-
2012-05-11$79,900
-
2010-12-22soldstatus $37,250 577-char remark
Show marketing remark (577 chars)
Start your home ownership here at 25 Mafalda Dr!! Comfortable & well-maintained 4 bedroom, 1.5 bath Cape Cod home! Roomy oak kitchen allows for excellent cooking potential. Great Living room to keep yourself entertained. Exposed stair case leading up to a Master w/ half bath. Natural woodwork throughout & beautiful hardwood floors. Full basement w/ glass block windows. Built 10x12 addition in 2005 w/ sliding glass doors to deck & fully fenced, deep back yard. 2 car, double door, large detached garage. Newer roof & HWT, '04 New furnace A/C ready.
-
2010-06-22$44,900 577-char remark
Show marketing remark (577 chars)
Start your home ownership here at 25 Mafalda Dr!! Comfortable & well-maintained 4 bedroom, 1.5 bath Cape Cod home! Roomy oak kitchen allows for excellent cooking potential. Great Living room to keep yourself entertained. Exposed stair case leading up to a Master w/ half bath. Natural woodwork throughout & beautiful hardwood floors. Full basement w/ glass block windows. Built 10x12 addition in 2005 w/ sliding glass doors to deck & fully fenced, deep back yard. 2 car, double door, large detached garage. Newer roof & HWT, '04 New furnace A/C ready.
-
2006-09-28soldstatus $83,500
-
1999-09-29soldstatus $69,500
ⓘ Source: listings_history table (triggers on properties + properties_extension) + one-shot
backfill from property_details.listing_events for pre-trigger history.
Tax reassessment forecast NY · Partial reset (capped growth)
- Current annual tax
- $5,373 · $448/mo
- Projected year-2 tax
- $5,373 · $448/mo
- Expected delta
- $0/yr ($0/mo · 0.0%)
ⓘ Screening estimate from a state-policy table — verify with the county assessor before closing.
Climate risk First Street
- Flood 1/10 Low FEMA zone X (unshaded) · 0% chance over 30 yrs
- Wildfire 1/10 Low
- Heat 2/10 Low 7 d/yr ≥93°F today · 15 d/yr by 30 yrs out
- Wind 1/10 Low
- Air quality 3/10 Moderate 2 unhealthy d/yr today · 3 by 30 yrs out
Nearby sold comps map
Loading sold comps map…
Walkable amenities ~0.75 mi
Loading nearby amenities…
Taxation est. · year 1
- Rental income
- $28,747
- − Mortgage interest
- −$10,077
- − Property taxes
- −$5,373
- − Insurance
- −$900
- − Repairs & maintenance
- −$2,300
- − Management
- −$2,300
- − Depreciation
- −$5,233
- Taxable income
- $2,565
- Est. tax owed @ 24.0%
- −$616
- After-tax cash flow
- $4,502/yr
For passive investors: Depreciation is non-cash, so a rental often shows a tax loss while cash-flowing — sheltering income. Rental losses are passive: they offset passive income freely, and up to $25,000/yr can offset ordinary (W-2) income if you actively participate and your MAGI is under $100k (phasing out to $0 by $150k); unused losses carry forward. On sale, claimed depreciation is recaptured at up to 25%, and gains may owe capital-gains tax (a 1031 exchange can defer both). Figures are a year-1 estimate at your 24.0% rate — not tax advice; consult a CPA.
Schools (NCES district)
- District
- Cleveland Hill Union Free School District
- NCES district ID
- 3607680
- Math proficiency
- 42% ▼ -15.00%
- Reading proficiency
- 46% ▼ -9.00%
- Median HH income
- $50,785
- Composite
- 37.87/100
- National rank
- #4323
- State rank
- #468 of 590 in NY
Livability — Cheektowaga
- Score
- 84/100
- State rank
- #54
- US rank
- #811
Category grades
Schools grade is shown separately in the Schools card above.
Census & demographics
- Census place
- Cheektowaga, NY
- County
- Erie County · 714,559 people
- City population
- 55,470
- Metro
- Buffalo-Cheektowaga, NY
- Population (ZIP)
- 42,524
- Household income
- $44,955
- Rent vs Own
- Severe rent burden
- 2873.0
Population outlook (Erie County) Hauer SSP2
- Today (2025)
- 933,037 people
- By 2030
- 935,181 · +0.2%
- By 2040
- 928,531 · -0.5%
- By 2050
- 905,725 · -2.9%
- By 2075
- 834,037 · -10.6%
- By 2100
- 708,033 · -24.1%
Race, ethnicity, and origin ACS 2023
- Neighborhood character
- Predominantly Black (67%)
- Race & ethnicity
- Black 67% White 15% Asian 7% Hispanic / Latino 6% Two or more races 6%
- Hispanic origin (detail)
- Puerto Rican 4%
- Common ancestry
- Romanian 4% Lithuanian 1% Italian 1%
- Foreign-born
- 9% · Canada, China
- Languages at home
- 88% English-only · Other Indo-European 4% Spanish 4% Chinese 1%
Political lean MEDSL · Erie
- 2024 margin
- Lean D (+9.7) · D 54.8% · R 45.2%
- 2008→2024 swing
- -7.9pp toward R · 2008: 17.5pp · 2024: 9.7pp
- All cycles
- 2024: D+9.7 2020: D+14.7 2016: D+4.8 2012: D+15.6 2008: D+17.5
Not yet ingested
- Civics
- —
Market trends
- HPI YoY
- ▼ -126.29%
- Current HPI
- 295.2966
- Rent YoY
- ▲ 0.67%
- Metro
- Buffalo-Cheektowaga, NY
- State GDP YoY
- ▲ 2.60%
- F500 in state
- 92
Industry mix (Fortune 500 HQ in NY)
| Industry | F500 HQs | Revenue |
|---|---|---|
| Financial Services | 10 | $950B |
|
||
| Consumer Goods | 9 | $162B |
|
||
| Insurance | 4 | $225B |
|
||
| Telecommunications | 2 | $144B |
|
||
| Pharmaceuticals | 2 | $112B |
|
||
| Media / Entertainment | 2 | $69B |
|
||
Price history
+158.8% since first listed8 events — show timeline
- 2026-05-27 Listed $179,900 WNYREIS
- 2013-06-27 Sold (Public Records) $78,302 Public Records
- 2013-06-27 Sold (Public Records) $83,300 Public Records
- 2012-05-11 Listed $79,900 WNYREIS
- 2010-12-22 Sold (MLS) $37,250 WNYREIS
- 2010-06-22 Listed $44,900 WNYREIS
- 2006-09-28 Sold (Public Records) $83,500 Public Records
- 1999-09-29 Sold (Public Records) $69,500 Public Records
Property tax history
+10.0%/yrLatest (2025): $5,373 · +2.1% YoY. Source: county tax records.
Cash-flow waterfall
monthlySold comps — $/sqft
last 12 mo · ≤1 miLoading sold comps…