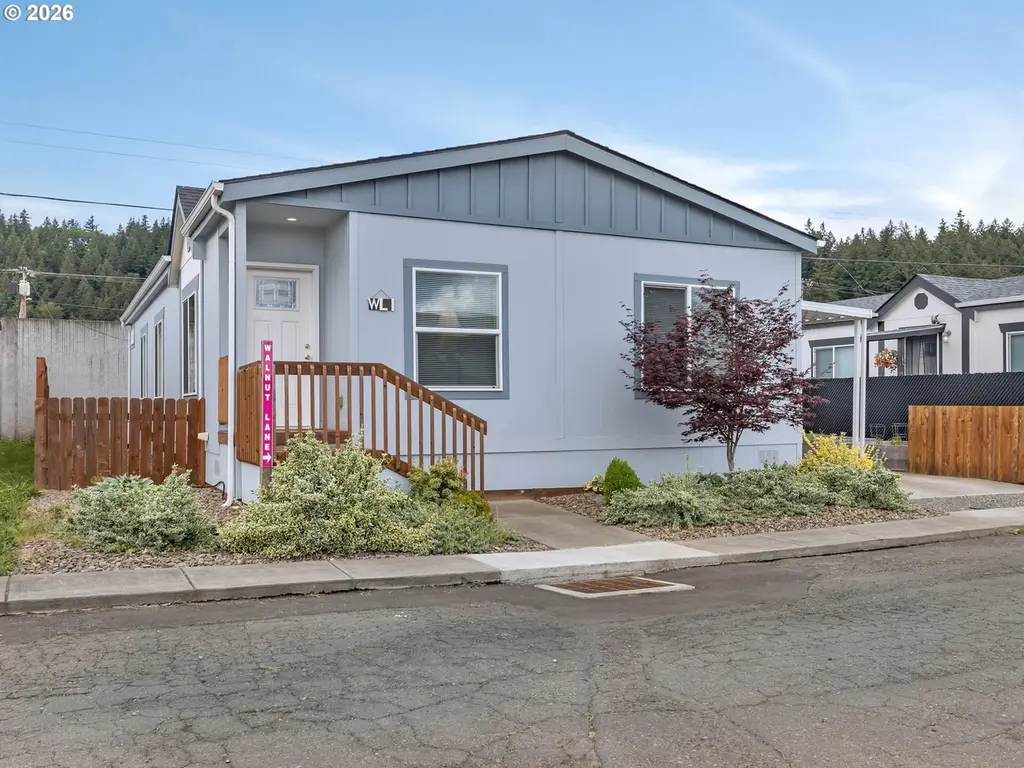
10701 SE Hwy 212 Unit WL 1
Happy Valley, OR 97015
$179,000C+
3 bd · 2.0 ba ·
1,512 sqft ·
Built 2021
· Manufactured
· Pending
· 5 DOM
Cashflow @ list (25.0% down · 7.5%)
Estimated rent
$2,417/mo
Mortgage (P&I)
−$939
Tax + insurance
−$298
HOA
−$0
Vac / Maint / Mgmt
−$507
Net cashflow
$672/mo
Annual
$8,066/yr
Cap rate
10.80%
Cash-on-cash
16.09%
DSCR
1.72
1% rule
1.35%
Cash to close
$50,120
Investor read
- This is a 3-bed/2.0-bath manufactured listed at $179k. Condition is rated good.
- At list price, monthly cash flow is $672 ($8k/yr) — positive.
- The deal already cash-flows at list — no discount required.
- Meets the 1% rule at list price ($2k rent vs $179k).
- Only 5 days on market — expect competitive offers; lowballing is unlikely to land.
- Local home prices are declining (-3.0%/yr); year-one equity from $1k of loan paydown is wiped out by about $5k of value loss. Plan a longer hold.
- Location reads 76/100 on livability (#76 in OR, #3,386 nationally) — a middle-class / working-renter tenant base. Strengths: employment A+, housing A+, crime A; Watch: amenities F, cost of living F.
- North Clackamas SD 12 (suburban): math 29% / reading 43% proficiency, ranked #22 of 58 in OR (top 38%) — families likely to look elsewhere, expect single-tenant / working-renter base with shorter leases.
- Zoned schools: Sunnyside Elementary School (math 24% / reading 34%, grade F, #263 of 412 statewide, top 68%, 427 students, 34% FRL); Rock Creek Middle School (math 19% / reading 44%, grade F, #82 of 128 statewide, top 64%, 902 students, 33% FRL); Clackamas High School (math 52% / reading 67%, grade C+, #23 of 143 statewide, top 19%, 1,224 students, 27% FRL) — zoned schools at 31% FRL track the district average.
- Market conditions: Rents rising (+2.5%/yr); 120 active listings in the ZIP; 7 comparable units currently listed for rent nearby; rentals leasing fast (median 8d on market — plan ~1-2 weeks tenant-placement turnaround); solid renter incomes; 946 units permitted in Clackamas County in 2024 (188 in 5+ unit buildings).
- Clackamas County population projected at +25% by 2050 — long-run rental-demand tailwind backs the buy-and-hold thesis.
- At projected returns (-3.0% appreciation + 2.5% rent growth), your $50k cash investment doubles in ~8 years — after that, you're playing with house money.
- Cap rate 10.8% vs local median 2.5% in Happy Valley — top-decile yield for the area; either an underpriced asset or a hidden risk that comps aren't pricing in. Stress-test before assuming the spread holds.
- This rent runs 33% of the median local income ($87k/yr) — at the standard rent-burdened threshold; future hikes will face affordability resistance.
Questions for listing agent
- Is there a deadline driving the sale (1031 exchange, divorce, estate, relocation)? That informs how much negotiation room exists.
- Schools are A-rated — typically a magnet for longer-tenancy family renters. What's the average tenant stay here, and is there a school-zone premium baked into asking?
- What's the average days-on-market for RENTAL listings here right now (not sales)? A rising rental-DOM trend means longer vacancies and softer asking-rent achievability than the comps imply.
- What's the recent tenant-quality profile in this submarket — average credit score on applications, eviction rate, late-payment / NSF rate, and stable-employment percentage? A property-management company in the area should have these aggregated.
- How much new for-sale + rental construction is in the pipeline within 1–3 miles? Heavy new supply typically softens prices + rents 12–24 months out; constrained supply supports both.
CashFlowRE · CFR-R6W9Q98AKQCA26
· Data 3 weeks ago
cashflowre.app · 2026-05-29