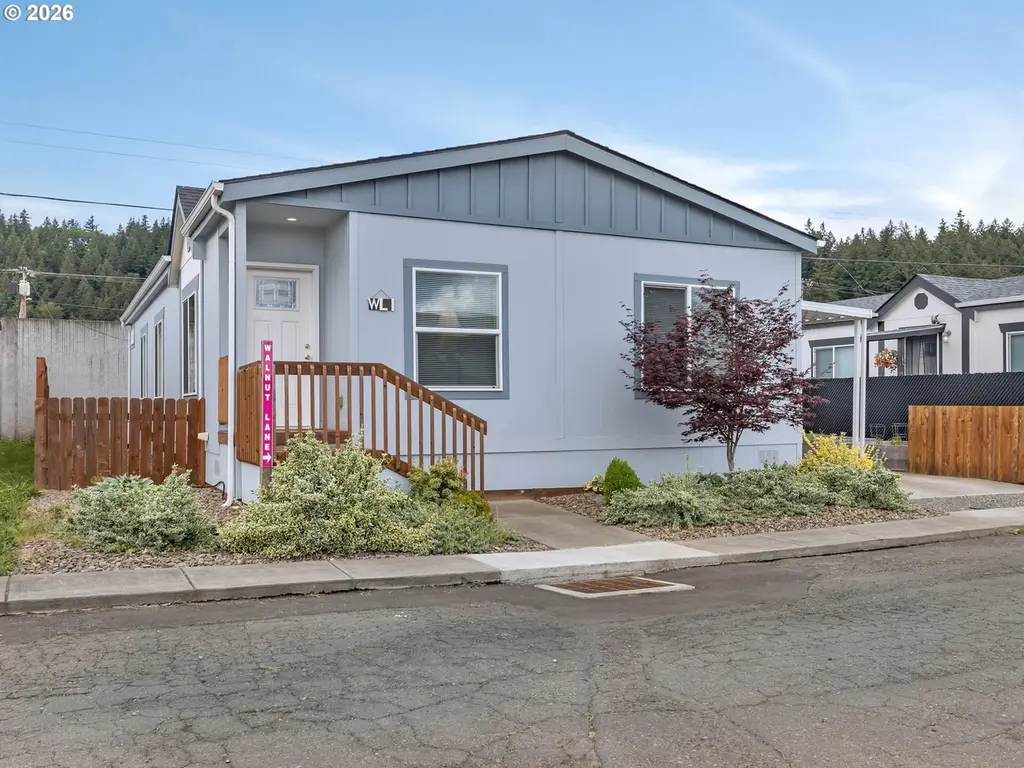
10701 SE Hwy 212 Unit WL 1 · Happy Valley, OR
Flood risk 1/10 · Minimal
- FEMA flood zone
- X (unshaded)
- Chance of flooding over 30 yrs
- 0.0%
- Est. flood insurance / yr
- $507 – $1,088
Fire risk 1/10 · Minimal
- Est. fire insurance / yr
- $498 – $926
Heat risk 3/10 · Minor
- Hot days now (above 93°F)
- 7 days/yr
- Hot days in 30 yrs
- 15 days/yr
Wind risk 1/10 · Minimal
- Chance of severe wind over 30 yrs
- —
Air-quality risk 10/10 · Severe
- Unhealthy air days now
- 18 days/yr
- Unhealthy air days in 30 yrs
- 20 days/yr
Risk factors via First Street. Map © Google.
Why this score? — see what drove the C+ grade
The composite is a weighted blend of 9 inputs, each scored 0–100. Each bar is that input's sub-score; the figure is the points it added to the 100-point composite (weight × sub-score).
- Cash flow +30.0/30.0
- DSCR +10.0/10.0
- 1% rule +8.5/10.0
- Condition / age +4.0/5.0
- Livability +3.8/5.0
- Schools +3.2/10.0
- Rent growth +3.1/5.0
- ARV discount +1.8/15.0
- Appreciation +0.0/10.0
$179,000
🖨 Deal sheet 📄 Offer letter ✓ Due diligence
Listing remarks
Welcome home to this charming and meticulously maintained 3 bedroom, 2 bathroom residence, proudly offered by its original owner. Inside, experience a touch of elegance with stunning coffered ceilings that elevate the main living areas. Outside, enjoy a vibrant lifestyle where green living meets community fun: cultivate your passion in the raised garden beds, then step out to enjoy the fantastic neighborhood amenities, including a sparkling pool and a community room for gathering with friends. This home is the perfect blend of style, comfort, and convenience!
Key facts
- Coffered ceilings
- Raised garden beds
- Community room
Tags
Property features AI
Finance
- Other: Property is resale; Main living area approximately 1,512 (listed as main level area total)
- Financial info: Monthly lot rent $979; Land lease expires December 31, 2026
- HOA & community: Park amenities include pool, meeting room, recreation facilities, grounds maintenance, and management; Park name: OAK ACRES (not a senior community); Land lease in effect (monthly lot rent)
Exterior
- Parking: Covered carport (2 spaces)
- Security: No specific security features listed
- Utilities: Electricity (fuel); Public water; Public sewer
- Home design: Manufactured home in a park (Waverly Crest model by Fleetwood Homes); Single-story (main living on one level); Built in 2021; No significant view; Located on a cul-de-sac; level lot; paved road
- Construction: Composition roof; Skirting foundation
- Exterior features: Covered patio; Porch; Raised garden beds; Tool shed; Panel exterior
Interior
- Kitchen: Dishwasher; Disposal; Free‑standing range; Free‑standing refrigerator; Microwave; Kitchen island; Pantry
- Bedrooms: Primary bedroom on main level with ensuite and walk-in closet; Second bedroom on main level with closet; Third bedroom on main level with closet
- Flooring: Wall-to-wall carpet; Vinyl flooring
- Bathrooms: Two full bathrooms (both on main level)
- Heating & cooling: Wall furnace heating; Central air conditioning
- Interior features: Laundry area on main level; Crawl space basement; Double-pane windows with vinyl frames; Washer/Dryer included; Island in kitchen; Pantry
- Laundry & utility: Washer and dryer; Electric tank water heater
Neighborhood map
What this means for you Summary
Snapshot
- This is a 3-bed/2.0-bath manufactured listed at $179k. Condition is rated good.
Deal economics
- At list price, monthly cash flow is $672 ($8k/yr) — positive.
- The deal already cash-flows at list — no discount required.
- Meets the 1% rule at list price ($2k rent vs $179k).
- Cap rate 10.8% vs local median 2.5% in Happy Valley — top-decile yield for the area; either an underpriced asset or a hidden risk that comps aren't pricing in. Stress-test before assuming the spread holds.
Location & tenants
- Location reads 76/100 on livability (#76 in OR, #3,386 nationally) — a middle-class / working-renter tenant base. Strengths: employment A+, housing A+, crime A; Watch: amenities F, cost of living F.
- North Clackamas SD 12 (suburban): math 29% / reading 43% proficiency, ranked #22 of 58 in OR (top 38%) — families likely to look elsewhere, expect single-tenant / working-renter base with shorter leases.
- Zoned schools: Sunnyside Elementary School (math 24% / reading 34%, grade F, #263 of 412 statewide, top 68%, 427 students, 34% FRL); Rock Creek Middle School (math 19% / reading 44%, grade F, #82 of 128 statewide, top 64%, 902 students, 33% FRL); Clackamas High School (math 52% / reading 67%, grade C+, #23 of 143 statewide, top 19%, 1,224 students, 27% FRL) — zoned schools at 31% FRL track the district average.
- Market conditions: Rents rising (+2.5%/yr); 120 active listings in the ZIP; 7 comparable units currently listed for rent nearby; rentals leasing fast (median 8d on market — plan ~1-2 weeks tenant-placement turnaround); solid renter incomes; 946 units permitted in Clackamas County in 2024 (188 in 5+ unit buildings).
- This rent runs 33% of the median local income ($87k/yr) — at the standard rent-burdened threshold; future hikes will face affordability resistance.
Forward outlook
- Local home prices are declining (-3.0%/yr); year-one equity from $1k of loan paydown is wiped out by about $5k of value loss. Plan a longer hold.
- Clackamas County population projected at +25% by 2050 — long-run rental-demand tailwind backs the buy-and-hold thesis.
- At projected returns (-3.0% appreciation + 2.5% rent growth), your $50k cash investment doubles in ~8 years — after that, you're playing with house money.
Negotiation context
- Only 5 days on market — expect competitive offers; lowballing is unlikely to land.
Questions for the listing agent
- Is there a deadline driving the sale (1031 exchange, divorce, estate, relocation)? That informs how much negotiation room exists.
- Schools are A-rated — typically a magnet for longer-tenancy family renters. What's the average tenant stay here, and is there a school-zone premium baked into asking?
- What's the average days-on-market for RENTAL listings here right now (not sales)? A rising rental-DOM trend means longer vacancies and softer asking-rent achievability than the comps imply.
- What's the recent tenant-quality profile in this submarket — average credit score on applications, eviction rate, late-payment / NSF rate, and stable-employment percentage? A property-management company in the area should have these aggregated.
- How much new for-sale + rental construction is in the pipeline within 1–3 miles? Heavy new supply typically softens prices + rents 12–24 months out; constrained supply supports both.
Investment metrics
- 1% rule
- 1.35% ✓
- Cap rate
- 10.80%
- Cash-on-cash
- 16.09%
- DSCR
- 1.72
- GRM
- 6.2
CMA / ARV
- ARV (on-the-fly)
- $158,760
- Comps found
- 7
Show comp detail 7 sales within ~0.75 mi
| Address | Dist | Beds/Ba | Sqft | Sold | Price | $/sf | Match |
|---|---|---|---|---|---|---|---|
| 10701 SE Hwy 212 Unit WL 1 | 0.00mi | 3/2.0 | 1,512 (0%) | 0mo | $180,000 | $119 | 100 |
| 10701 SE Highway 212 Unit Y5 | 0.19mi | 3/2.0 | 1,512 (0%) | 18mo | $176,500 | $117 | 76 |
| 10701 SE Highway 212 Unit Y6 | 0.19mi | 4/2.0 (+1) | 1,620 (+7%) | 4mo | $169,900 | $105 | 70 |
| 10701 SE Highway 212 Unit OL6 | 0.12mi | 4/2.0 (+1) | 1,440 (-5%) | 15mo | $120,000 | $83 | 69 |
| 10701 SE Highway 212 Unit Y2 | 0.03mi | 3/2.0 | 1,350 (-11%) | 18mo | $139,850 | $104 | 65 |
| 10701 SE 212 Hwy Unit H6 | 0.20mi | 3/2.0 | 1,296 (-14%) | 10mo | $125,500 | $97 | 59 |
| 10701 SE Highway 212 Unit N6 | 0.08mi | 3/2.0 | 1,344 (-11%) | 23mo | $175,000 | $130 | 58 |
Match score weights: distance 35% · size 25% · config 20% · recency 20%. Top-matched comps best support the ARV.
Projected returns pro-forma
-3.0% appreciation · 2.48% rent growth · sell at horizon
- IRR
- 6.5%
- Equity multiple
- 1.25×
- Total profit
- $12,581
- Equity at exit
- $26,689
- IRR
- 15.4%
- Equity multiple
- 2.22×
- Total profit
- $61,118
- Equity at exit
- $15,477
Cash invested: $50,120 (down + closing). Projections, not guarantees.
Landlord ↔ Tenant lean methodology
- Overall (STATE)
- 28 Tenant-Leaning
- State Oregon
- 28 Tenant-Leaning · D+6
- County
- — inherits STATE
- City
- — inherits STATE
ZIP-level market 97015
- Rents YoY
- 2.5%
- Active inventory
- 120
- Price-to-rent
- 6.2×
Monthly cashflow live
- Estimated rent
- $2,417 high interval (Pro) →
- Mortgage (P&I)
- −$939
- Tax est. 1.5%
- −$224 /mo · $2,685/yr
- Insurance
- −$75
- HOA
- −$0
- Vacancy / Maint / Mgmt
- −$507
- Net cashflow
- $672
Break-even live
UW: 25.0% down · 7.5% · 30yr · 1.5% tax · 5.0% vac · 8.0% maint · 8.0% mgmt
Financing live
Cash to close
- Down payment
- $44,750
- Closing costs
- $5,370
- Reserves months
- —
- Total cash needed
- —
Loan-product check · same deal, 3 products live
Conventional
25% down · 7.5% · 30yr
- Down + closing
- —
- Monthly P&I
- —
- Monthly cashflow
- —
- DSCR
- —
- Eligible?
- —
Personal DTI + credit; lowest rate.
DSCR
20% down · 8.5% · 30yr
- Down + closing
- —
- Monthly P&I
- —
- Monthly cashflow
- —
- DSCR
- —
- Eligible?
- —
No personal income docs; deal must DSCR.
Hard money
10% down · 12.0% · 12mo
- Down + closing
- —
- Monthly P&I
- —
- Monthly cashflow
- —
- DSCR
- —
- Eligible?
- —
Short-term bridge; refi at stabilization.
Rent comps 7 comps
| Address | Beds | Baths | Sqft | Rent | $/sqft | DOM | Units | Dist |
|---|---|---|---|---|---|---|---|---|
| 12301 SE Hubbard Rd Clackamas, OR | 2.0–3.0 | 1.0–2.0 | 936 | $2,063 | $2.20 | 10d | 4 | 0.83mi |
| 13777 SE 115th Ave Clackamas, OR | 3.0 | 3.0 | 2088 | $3,495 | $1.67 | 24d | 1 | 0.89mi |
| 16500 SE 82nd Dr Clackamas, OR | 2.0–3.0 | 1.0–2.0 | 1006 | $2,273 | $2.26 | 7d | 4 | 0.92mi |
| 9750 SE Talbert St Clackamas, OR | 3.0 | 2.0 | 1128 | $2,099 | $1.86 | 12d | 1 | 1.18mi |
| 9840 SE Talbert St Clackamas, OR | 1.0–3.0 | 1.0–2.0 | 907 | $2,199 | $2.42 | 2d | 26 | 1.20mi |
| 13300 SE Hubbard Rd Clackamas, OR | 3.0 | 1.0–2.0 | 818 | $2,290 | $2.80 | 2d | 6 | 1.23mi |
| 11480 SE Sunnyside Rd Clackamas, OR | 1.0–3.0 | 1.0–2.0 | 936 | $2,258 | $2.41 | 2d | 16 | 1.47mi |
Listing history 1 events
-
2026-05-21$179,000 Active
ⓘ Source: listings_history table (triggers on properties + properties_extension) + one-shot
backfill from property_details.listing_events for pre-trigger history.
Climate risk First Street
- Flood 1/10 Low FEMA zone X (unshaded) · 0% chance over 30 yrs
- Wildfire 1/10 Low
- Heat 3/10 Moderate 7 d/yr ≥93°F today · 15 d/yr by 30 yrs out
- Wind 1/10 Low
- Air quality 10/10 Extreme 18 unhealthy d/yr today · 20 by 30 yrs out
Nearby sold comps map
Loading sold comps map…
Walkable amenities ~0.75 mi
Loading nearby amenities…
Taxation est. · year 1
- Rental income
- $29,000
- − Mortgage interest
- −$10,027
- − Property taxes
- −$2,685
- − Insurance
- −$895
- − Repairs & maintenance
- −$2,320
- − Management
- −$2,320
- − Depreciation
- −$5,207
- Taxable income
- $5,546
- Est. tax owed @ 24.0%
- −$1,331
- After-tax cash flow
- $6,735/yr
For passive investors: Depreciation is non-cash, so a rental often shows a tax loss while cash-flowing — sheltering income. Rental losses are passive: they offset passive income freely, and up to $25,000/yr can offset ordinary (W-2) income if you actively participate and your MAGI is under $100k (phasing out to $0 by $150k); unused losses carry forward. On sale, claimed depreciation is recaptured at up to 25%, and gains may owe capital-gains tax (a 1031 exchange can defer both). Figures are a year-1 estimate at your 24.0% rate — not tax advice; consult a CPA.
Condition & rehab AI · 7 photos
This home is in good condition with a well-maintained exterior and interior. It is a great investment opportunity with potential for a fresh coat of paint to enhance its curb appeal and value.
Value-add opportunities
- Both Paint exterior siding — Fresh paint can enhance the home's curb appeal and increase its value.
- Both Inspect and clean gutters — Clean gutters improve the home's appearance and prevent water damage to the siding and foundation.
Renovation cost estimate screening
Value-add ROI direction
- Both Paint exterior siding — Fresh paint can enhance the home's curb appeal and increase its value. ↑
- Both Inspect and clean gutters — Clean gutters improve the home's appearance and prevent water damage to the siding and foundation. ↑
ⓘ Cost ranges are severity-bucket heuristics (US national rule-of-thumb). Get contractor quotes + a written scope before underwriting a rehab budget.
Schools (NCES district)
- District
- North Clackamas SD 12
- NCES district ID
- 4108830
- Math proficiency
- 29% ▼ -14.00%
- Reading proficiency
- 43% ▼ -13.00%
- Median HH income
- $60,217
- Composite
- 32.1/100
- National rank
- #5807
- State rank
- #22 of 58 in OR
Livability — Happy Valley
- Score
- 76/100
- State rank
- #76
- US rank
- #3386
Category grades
Schools grade is shown separately in the Schools card above.
Census & demographics
- County
- Clackamas County · 361,406 people
- City population
- 34,567
- Metro
- Portland-Vancouver-Hillsboro, OR-WA
- Population (ZIP)
- 24,433
- Household income
- $87,333
- Rent vs Own
- Severe rent burden
- 1166.0
Population outlook (Clackamas County) Hauer SSP2
- Today (2025)
- 458,456 people
- By 2030
- 485,185 · +5.8%
- By 2040
- 532,932 · +16.2%
- By 2050
- 574,445 · +25.3%
- By 2075
- 665,497 · +45.2%
- By 2100
- 697,488 · +52.1%
Race, ethnicity, and origin ACS 2023
- Neighborhood character
- Predominantly White (66%)
- Race & ethnicity
- White 66% Hispanic / Latino 15% Two or more races 12% Asian 11% Black 2%
- Hispanic origin (detail)
- Mexican 13%
- Common ancestry
- Italian 4% Scotch-Irish 4% Lithuanian 3%
- Foreign-born
- 15% · Canada, China, Vietnam
- Languages at home
- 74% English-only · Spanish 11% Chinese 5% Russian/Polish/Slavic 3%
Political lean MEDSL · Clackamas
- 2024 margin
- Lean D (+9.7) · D 53.4% · R 43.6% · Other 3.0%
- 2008→2024 swing
- -0.6pp no change · 2008: 10.4pp · 2024: 9.7pp
- All cycles
- 2024: D+9.7 2020: D+11.1 2016: D+6.1 2012: D+3.5 2008: D+10.4
Not yet ingested
- Civics
- —
Market trends
- HPI YoY
- ▼ -170.50%
- Current HPI
- 295.7295
- Rent YoY
- ▲ 2.48%
- Metro
- Portland-Vancouver-Hillsboro, OR-WA
- State GDP YoY
- ▲ 2.05%
- F500 in state
- 2
Industry mix (Fortune 500 HQ in OR)
| Industry | F500 HQs | Revenue |
|---|---|---|
| Consumer Goods | 1 | $51B |
|
||
Price history
1 event — show timeline
- 2026-05-21 Listed $179,000 RMLS
Cash-flow waterfall
monthlySold comps — $/sqft
last 12 mo · ≤1 miLoading sold comps…