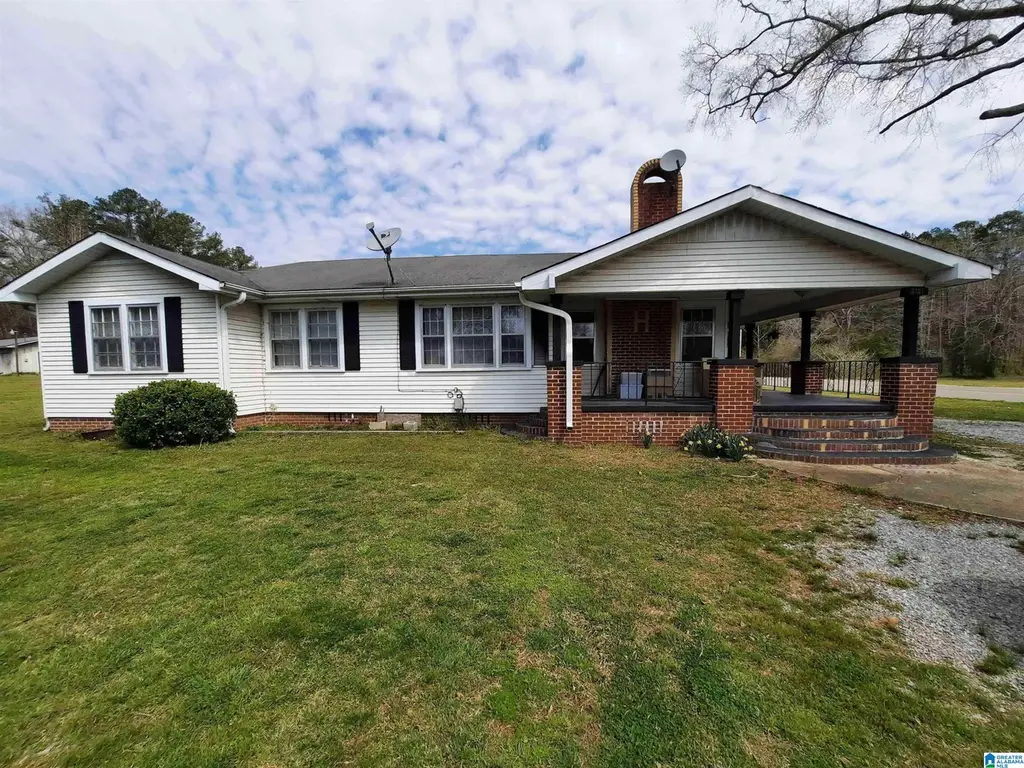
3701 Roy Webb Rd
Piedmont, AL 36265
$225,000D
5 bd · 1.0 ba ·
2,303 sqft ·
Built 1951
· SingleFamily
· Active
· 81 DOM
Cashflow @ list (25.0% down · 7.5%)
Estimated rent
$1,519/mo
Mortgage (P&I)
−$1,180
Tax + insurance
−$166
HOA
−$0
Vac / Maint / Mgmt
−$319
Net cashflow
$-146/mo
Annual
$-1,750/yr
Cap rate
5.52%
Cash-on-cash
-2.78%
DSCR
0.88
1% rule
0.67%
Cash to close
$63,000
Investor read
- This is a 5-bed/1.0-bath single-family listed at $225k.
- At list price, monthly cash flow is $-146 ($-2k/yr) — negative.
- To cash-flow at today's rent, offer at most $199k (11.5% below list).
- To meet the 1% rule (rent ≥ 1% of price), the offer needs to be $152k (32.5% below list).
- It's been on market 81 days — a 6% lower offer ($212k) is reasonable based on typical stale-listing flexibility.
- Recommended offer: $152k (32.5% below list) — sets the bar for 1% rule.
- Local home prices are declining (-3.0%/yr); year-one equity from $2k of loan paydown is wiped out by about $7k of value loss. Plan a longer hold.
- Location reads 57/100 on livability (#402 in AL) — a working-class tenant base; expect higher turnover. Strengths: cost of living A+, housing A+; Watch: schools C-, crime F, amenities F.
- Calhoun County (rural): math 19% / reading 49% proficiency, ranked #46 of 129 in AL (top 36%) — families likely to look elsewhere, expect single-tenant / working-renter base with shorter leases.
- Watch-outs: built in 1951 — expect roof / HVAC / electrical / plumbing capex.
- Market conditions: Rents rising fast (+5.6%/yr); 88 active listings in the ZIP; 135 units permitted in Calhoun County in 2024 (0 in 5+ unit buildings).
- Calhoun County population projected at -21% by 2050 — secular population decline; favor cash flow + early exit over multi-decade hold.
- 2 sale attempts since 4y ago with the ask held roughly flat each time — persistent listings suggest the price (not the market) is what's stuck; bring a comps-based counter.
- Climate carrying-cost: moderate wind risk, 25% chance of damaging wind over 30y; major wildfire risk; extreme-heat days projected 7→20/yr by 2055 (HVAC capex compounding) — expect insurance premiums to compound above CPI over the hold.
- Cap rate 5.5% vs local median 4.5% in Piedmont — meaningfully above typical; check what's discounted (condition, days-on-market, listing class) to confirm the premium yield is real.
- This rent runs 33% of the median local income ($55k/yr) — at the standard rent-burdened threshold; future hikes will face affordability resistance.
Questions for listing agent
- What do current leases actually rent for vs. the listed asking? Can we see a recent rent roll and the last 12 months of T-12 income?
- It's been on market 81 days. Have you received any prior offers? Is the seller open to a 33% concession, seller financing, or rate buy-down credit?
- Built in 1951 — when were the roof, HVAC, electrical panel, plumbing, and water heater last replaced?
- Why hasn't it sold? Are there any deal-killer items the seller is aware of (foundation, flood, title, zoning, code violations)?
- Is there a deadline driving the sale (1031 exchange, divorce, estate, relocation)? That informs how much negotiation room exists.
- Crime grade is F in this area — have there been break-ins, vandalism, or insurance claims at this property in the last 3 years? What carrier currently insures it and at what premium?
- The area grade is low — what's the realistic commute time and amenity access for the typical tenant pool here? Any planned neighborhood developments (good or bad) we should know about?
- What's the average days-on-market for RENTAL listings here right now (not sales)? A rising rental-DOM trend means longer vacancies and softer asking-rent achievability than the comps imply.
CashFlowRE · CFR-R7CTZ82EAAZ5A5
· Data 1 day ago
cashflowre.app · 2026-05-29