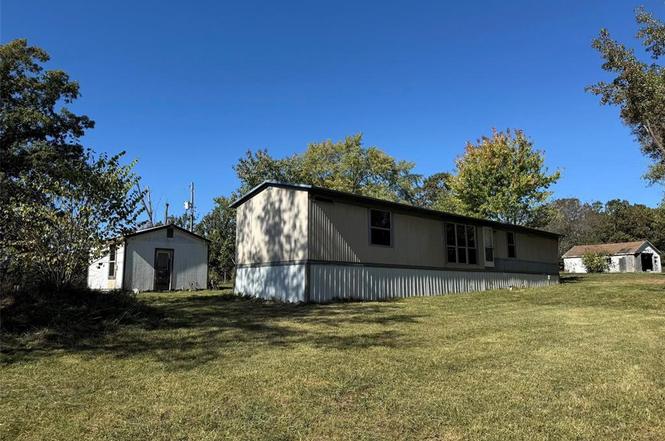
97 S County Road 6170
Salem, MO 65560
$139,000D-
2 bd · 2.0 ba ·
1,136 sqft ·
Built 1989
· Manufactured
· Active
· 240 DOM
Cashflow @ list (25.0% down · 7.5%)
Estimated rent
$827/mo
Mortgage (P&I)
−$729
Tax + insurance
−$82
HOA
−$0
Vac / Maint / Mgmt
−$174
Net cashflow
$-157/mo
Annual
$-1,889/yr
Cap rate
4.93%
Cash-on-cash
-4.85%
DSCR
0.78
1% rule
0.59%
Cash to close
$38,920
Investor read
- This is a 2-bed/2.0-bath manufactured listed at $139k.
- At list price, monthly cash flow is $-157 ($-2k/yr) — negative.
- To cash-flow at today's rent, offer at most $111k (20.0% below list).
- To meet the 1% rule (rent ≥ 1% of price), the offer needs to be $83k (40.5% below list).
- It's been on market 240 days — a 12% lower offer ($122k) is reasonable based on typical stale-listing flexibility.
- Recommended offer: $83k (40.5% below list) — sets the bar for 1% rule.
- In year one you build about $9k of equity ($961 loan paydown + $8k appreciation (5.7% local appreciation)).
- Location reads 69/100 on livability (#157 in MO) — a middle-class / working-renter tenant base. Strengths: cost of living A+, health & safety A+, crime B; Watch: amenities C-, commute F, employment F.
- Green Forest R-II (rural): math 70% / reading 60% proficiency, ranked #24 of 535 in MO (top 4%) — acceptable for families but not a draw, mixed tenant base, ~2y average lease.
- Zoned schools: Green Forest Elem. (math 72% / reading 57%, grade B, #70 of 1,115 statewide, top 8%, 155 students, 52% FRL) — zoned schools at 52% FRL track the district average.
- Market conditions: 169 active listings in the ZIP; 3 units permitted in Dent County in 2024 (0 in 5+ unit buildings).
- Dent County population projected at -14% by 2050 — secular population decline; favor cash flow + early exit over multi-decade hold.
- 2 sale attempts with the ask held roughly flat each time — persistent listings suggest the price (not the market) is what's stuck; bring a comps-based counter.
- By year 5, paydown + projected appreciation supports a ~$39k cash-out refi (75% LTV) — recoverable capital for the next deal without selling this one.
- Climate carrying-cost: moderate wildfire risk — expect insurance premiums to compound above CPI over the hold.
- Cap rate 4.9% vs local median 2.7% in Salem — top-decile yield for the area; either an underpriced asset or a hidden risk that comps aren't pricing in. Stress-test before assuming the spread holds.
Questions for listing agent
- What do current leases actually rent for vs. the listed asking? Can we see a recent rent roll and the last 12 months of T-12 income?
- It's been on market 240 days. Have you received any prior offers? Is the seller open to a 41% concession, seller financing, or rate buy-down credit?
- Why hasn't it sold? Are there any deal-killer items the seller is aware of (foundation, flood, title, zoning, code violations)?
- Is there a deadline driving the sale (1031 exchange, divorce, estate, relocation)? That informs how much negotiation room exists.
- Schools are D-rated, which usually means shorter tenancies and higher turnover. Who's the typical renter profile here, and what's been the actual vacancy rate?
- The area grade is low — what's the realistic commute time and amenity access for the typical tenant pool here? Any planned neighborhood developments (good or bad) we should know about?
- What's the average days-on-market for RENTAL listings here right now (not sales)? A rising rental-DOM trend means longer vacancies and softer asking-rent achievability than the comps imply.
- What's the recent tenant-quality profile in this submarket — average credit score on applications, eviction rate, late-payment / NSF rate, and stable-employment percentage? A property-management company in the area should have these aggregated.
CashFlowRE · CFR-R7SSHM2RBFE45V
· Data 2 days ago
cashflowre.app · 2026-05-29