97 S County Road 6170 · Salem, MO
Flood risk 1/10 · Minimal
- FEMA flood zone
- X (unshaded)
- Chance of flooding over 30 yrs
- 0.0%
- Est. flood insurance / yr
- $507 – $1,088
Fire risk 5/10 · Moderate
- Est. fire insurance / yr
- $1,054 – $1,958
Heat risk 4/10 · Minor
- Hot days now (above 107°F)
- 7 days/yr
- Hot days in 30 yrs
- 20 days/yr
Wind risk 2/10 · Minimal
- Chance of severe wind over 30 yrs
- 0.0%
Air-quality risk 2/10 · Minimal
- Unhealthy air days now
- 0 days/yr
- Unhealthy air days in 30 yrs
- 1 days/yr
Risk factors via First Street. Map © Google.
Why this score? — see what drove the D- grade
The composite is a weighted blend of 9 inputs, each scored 0–100. Each bar is that input's sub-score; the figure is the points it added to the 100-point composite (weight × sub-score).
- Cash flow +7.8/30.0
- Appreciation +7.8/10.0
- ARV discount +7.5/15.0
- Schools +5.6/10.0
- Livability +3.5/5.0
- Rent growth +2.5/5.0
- Condition / age +2.5/5.0
- DSCR +1.8/10.0
- 1% rule +0.9/10.0
$139,000
🖨 Deal sheet 📄 Offer letter ✓ Due diligence
Listing remarks
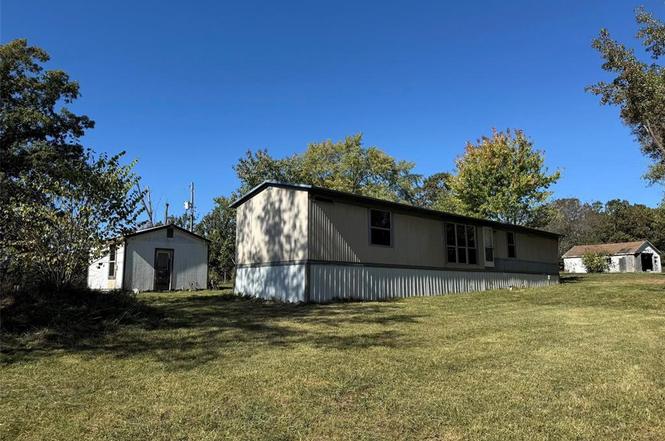
Country Living on 5.30 acres M/L with a Single wide (16 x 70) 2 Bedroom 2 Bath home with underpinning & tie downs and a back Deck and sidewalk. Has a one car 15 x 20 detached garage with opener, 14 x 16 storage shed, a 10 x 10 storage shed, Well House and another older garage/shop building. Has a lagoon and a drilled well. Intercounty electric is the provider, Green Forest School and Salem Fire district. This is on a dead end road so there is only one other home at the end of the road. Current River and Montauk isn't far from this property! Don't let this get away from you! Call for your appointment today to see this.
Key facts
- Storage shed
- Back deck
- Dead end road
Tags
Property features AI
Finance
- Financial info: Lease not considered
Exterior
- Parking: Driveway; Garage with garage door opener (garage faces front); Off-street parking; 1-car garage (approx. 15 x 20)
- Security: Storm door(s)
- Utilities: Well water; Lagoon septic; 220-volt electric; Electricity connected; Leased propane
- Home design: Manufactured home; One level
- Construction: Metal siding; Metal roof; Block and pillar/post/pier foundation (see remarks); Built year per assessor
- Exterior features: Deck; Partial fencing (see remarks); Back yard; Level lot; Suitable for horses
Interior
- Kitchen: Range hood; Free-standing gas range; Refrigerator
- Bedrooms: 2 bedrooms on the main level
- Flooring: Carpet; Vinyl
- Bathrooms: 2 full bathrooms on the main level
- Heating & cooling: Forced air heating (propane); Central air conditioning
- Interior features: Eat-in kitchen; Kitchen/dining combo
- Laundry & utility: Electric water heater
Neighborhood map
What this means for you Summary
Snapshot
- This is a 2-bed/2.0-bath manufactured listed at $139k.
Deal economics
- At list price, monthly cash flow is $-157 ($-2k/yr) — negative.
- To cash-flow at today's rent, offer at most $111k (20.0% below list).
- To meet the 1% rule (rent ≥ 1% of price), the offer needs to be $83k (40.5% below list).
- Recommended offer: $83k (40.5% below list) — sets the bar for 1% rule.
- Cap rate 4.9% vs local median 2.7% in Salem — top-decile yield for the area; either an underpriced asset or a hidden risk that comps aren't pricing in. Stress-test before assuming the spread holds.
Location & tenants
- Location reads 69/100 on livability (#157 in MO) — a middle-class / working-renter tenant base. Strengths: cost of living A+, health & safety A+, crime B; Watch: amenities C-, commute F, employment F.
- Green Forest R-II (rural): math 70% / reading 60% proficiency, ranked #24 of 535 in MO (top 4%) — acceptable for families but not a draw, mixed tenant base, ~2y average lease.
- Zoned schools: Green Forest Elem. (math 72% / reading 57%, grade B, #70 of 1,115 statewide, top 8%, 155 students, 52% FRL) — zoned schools at 52% FRL track the district average.
- Market conditions: 169 active listings in the ZIP; 3 units permitted in Dent County in 2024 (0 in 5+ unit buildings).
Forward outlook
- In year one you build about $9k of equity ($961 loan paydown + $8k appreciation (5.7% local appreciation)).
- Dent County population projected at -14% by 2050 — secular population decline; favor cash flow + early exit over multi-decade hold.
- By year 5, paydown + projected appreciation supports a ~$39k cash-out refi (75% LTV) — recoverable capital for the next deal without selling this one.
Negotiation context
- It's been on market 240 days — a 12% lower offer ($122k) is reasonable based on typical stale-listing flexibility.
- 2 sale attempts with the ask held roughly flat each time — persistent listings suggest the price (not the market) is what's stuck; bring a comps-based counter.
Risks & watch-outs
- Climate carrying-cost: moderate wildfire risk — expect insurance premiums to compound above CPI over the hold.
Questions for the listing agent
- What do current leases actually rent for vs. the listed asking? Can we see a recent rent roll and the last 12 months of T-12 income?
- It's been on market 240 days. Have you received any prior offers? Is the seller open to a 41% concession, seller financing, or rate buy-down credit?
- Why hasn't it sold? Are there any deal-killer items the seller is aware of (foundation, flood, title, zoning, code violations)?
- Is there a deadline driving the sale (1031 exchange, divorce, estate, relocation)? That informs how much negotiation room exists.
- Schools are D-rated, which usually means shorter tenancies and higher turnover. Who's the typical renter profile here, and what's been the actual vacancy rate?
- The area grade is low — what's the realistic commute time and amenity access for the typical tenant pool here? Any planned neighborhood developments (good or bad) we should know about?
- What's the average days-on-market for RENTAL listings here right now (not sales)? A rising rental-DOM trend means longer vacancies and softer asking-rent achievability than the comps imply.
- What's the recent tenant-quality profile in this submarket — average credit score on applications, eviction rate, late-payment / NSF rate, and stable-employment percentage? A property-management company in the area should have these aggregated.
- How much new for-sale + rental construction is in the pipeline within 1–3 miles? Heavy new supply typically softens prices + rents 12–24 months out; constrained supply supports both.
Investment metrics
- 1% rule
- 0.59% ✗
- Cap rate
- 4.93%
- Cash-on-cash
- -4.85%
- DSCR
- 0.78
- GRM
- 14.0
CMA / ARV
No comps found within radius.
Projected returns pro-forma
5.66% appreciation · 3.0% rent growth · sell at horizon
- IRR
- 10.5%
- Equity multiple
- 1.70×
- Total profit
- $27,205
- Equity at exit
- $84,377
- IRR
- 11.7%
- Equity multiple
- 3.27×
- Total profit
- $88,516
- Equity at exit
- $150,485
Cash invested: $38,920 (down + closing). Projections, not guarantees.
Landlord ↔ Tenant lean methodology
- Overall (STATE)
- 81 Strongly Landlord-Friendly
- State Missouri
- 81 Strongly Landlord-Friendly · R+10
- County
- — inherits STATE
- City
- — inherits STATE
ZIP-level market 65560
- Home prices YoY
- 2.4%
- Active inventory
- 169
- Price-to-rent
- 14.0×
Monthly cashflow live
- Estimated rent
- $827 medium interval (Pro) →
- Mortgage (P&I)
- −$729
- Tax from tax record
- −$24 /mo · $286/yr
- Insurance
- −$58
- HOA
- −$0
- Vacancy / Maint / Mgmt
- −$174
- Net cashflow
- $-157
Break-even live
UW: 25.0% down · 7.5% · 30yr · 1.5% tax · 5.0% vac · 8.0% maint · 8.0% mgmt
Financing live
Cash to close
- Down payment
- $34,750
- Closing costs
- $4,170
- Reserves months
- —
- Total cash needed
- —
Loan-product check · same deal, 3 products live
Conventional
25% down · 7.5% · 30yr
- Down + closing
- —
- Monthly P&I
- —
- Monthly cashflow
- —
- DSCR
- —
- Eligible?
- —
Personal DTI + credit; lowest rate.
DSCR
20% down · 8.5% · 30yr
- Down + closing
- —
- Monthly P&I
- —
- Monthly cashflow
- —
- DSCR
- —
- Eligible?
- —
No personal income docs; deal must DSCR.
Hard money
10% down · 12.0% · 12mo
- Down + closing
- —
- Monthly P&I
- —
- Monthly cashflow
- —
- DSCR
- —
- Eligible?
- —
Short-term bridge; refi at stabilization.
Listing history 17 events
-
2026-06-18days on market $139,000 Active 240 DOM
-
2026-06-17days on market $139,000 Active 239 DOM
-
2026-06-16days on market $139,000 Active 238 DOM
-
2026-06-15days on market $139,000 Active 237 DOM
-
2026-06-13days on market $139,000 Active 235 DOM
-
2026-06-12days on market $139,000 Active 234 DOM
-
2026-06-09days on market $139,000 Active 231 DOM
-
2026-06-08days on market $139,000 Active 230 DOM
-
2026-06-07days on market $139,000 Active 229 DOM
-
2026-06-05days on market $139,000 Active 227 DOM
-
2026-06-04days on market $139,000 Active 225 DOM
-
2026-06-02days on market $139,000 Active 224 DOM
-
2026-06-01days on market $139,000 Active 223 DOM
-
2026-05-31days on market $139,000 Active 222 DOM
-
2026-05-07status Active
-
2026-05-01historical Active Under Contract
-
2025-10-22$139,000 Active
ⓘ Source: listings_history table (triggers on properties + properties_extension) + one-shot
backfill from property_details.listing_events for pre-trigger history.
Tax reassessment forecast MO · Resets to sale price
- Current annual tax
- $286 · $24/mo
- Projected year-2 tax
- $1,348 · $112/mo
- Expected delta
- +$1,063/yr (+$89/mo · 372.2%)
ⓘ Screening estimate from a state-policy table — verify with the county assessor before closing.
Climate risk First Street
- Flood 1/10 Low FEMA zone X (unshaded) · 0% chance over 30 yrs
- Wildfire 5/10 Major
- Heat 4/10 Moderate 7 d/yr ≥107°F today · 20 d/yr by 30 yrs out
- Wind 2/10 Low 0% chance of damaging wind over 30 yrs
- Air quality 2/10 Low 0 unhealthy d/yr today · 1 by 30 yrs out
Nearby sold comps map
Loading sold comps map…
Walkable amenities ~0.75 mi
Loading nearby amenities…
Taxation est. · year 1
- Rental income
- $9,923
- − Mortgage interest
- −$7,786
- − Property taxes
- −$286
- − Insurance
- −$695
- − Repairs & maintenance
- −$794
- − Management
- −$794
- − Depreciation
- −$4,044
- Taxable loss
- −$4,475
- Est. tax savings @ 24.0%
- +$1,074
- After-tax cash flow
- $-815/yr
For passive investors: Depreciation is non-cash, so a rental often shows a tax loss while cash-flowing — sheltering income. Rental losses are passive: they offset passive income freely, and up to $25,000/yr can offset ordinary (W-2) income if you actively participate and your MAGI is under $100k (phasing out to $0 by $150k); unused losses carry forward. On sale, claimed depreciation is recaptured at up to 25%, and gains may owe capital-gains tax (a 1031 exchange can defer both). Figures are a year-1 estimate at your 24.0% rate — not tax advice; consult a CPA.
Schools (NCES district)
- District
- Green Forest R-II
- NCES district ID
- 2913260
- Math proficiency
- 70% ▲ 5.00%
- Reading proficiency
- 60% ▬ 0.00%
- Median HH income
- $41,265
- Composite
- 55.81/100
- National rank
- #2602
- State rank
- #24 of 535 in MO
Livability — Salem
- Score
- 69/100
- State rank
- #157
- US rank
- #8725
Category grades
Schools grade is shown separately in the Schools card above.
Census & demographics
- Population (ZIP)
- 13,634
Population outlook (Dent County) Hauer SSP2
- Today (2025)
- 15,149 people
- By 2030
- 14,734 · -2.7%
- By 2040
- 13,862 · -8.5%
- By 2050
- 12,959 · -14.5%
- By 2075
- 11,217 · -26.0%
- By 2100
- 9,399 · -38.0%
Race, ethnicity, and origin ACS 2023
- Neighborhood character
- Predominantly White (92%)
- Race & ethnicity
- White 92% Two or more races 5% Hispanic / Latino 2%
- Common ancestry
- Italian 2% Lithuanian 2% Slovak 2%
- Foreign-born
- 2% · China
Political lean MEDSL · Dent
- 2024 margin
- Solid R (+70.2) · D 14.4% · R 84.7%
- 2008→2024 swing
- -32.4pp toward R · 2008: -37.8pp · 2024: -70.2pp
- All cycles
- 2024: R+70.2 2020: R+69.0 2016: R+68.2 2012: R+49.6 2008: R+37.8
Not yet ingested
- Civics
- —
Market trends
- HPI YoY
- ▲ 5.66%
- Current HPI
- 238.9175
- Rent YoY
- —
- Metro
- —
- State GDP YoY
- ▲ 1.84%
- F500 in state
- 20
Industry mix (Fortune 500 HQ in MO)
| Industry | F500 HQs | Revenue |
|---|---|---|
| Healthcare | 1 | $163B |
|
||
| Insurance | 1 | $21B |
|
||
| Industrial Technology | 1 | $17B |
|
||
| Retail | 1 | $16B |
|
||
| Industrial Distribution | 1 | $10B |
|
||
| Utilities | 1 | $9B |
|
||
Price history
3 events — show timeline
- 2026-05-07 Relisted — MARIS as Distributed by MLS Grid
- 2026-05-01 Contingent — MARIS as Distributed by MLS Grid
- 2025-10-22 Listed $139,000 MARIS as Distributed by MLS Grid
Property tax history
+1.2%/yrLatest (2025): $286 · +6.7% YoY. Source: county tax records.
Cash-flow waterfall
monthlySold comps — $/sqft
last 12 mo · ≤1 miLoading sold comps…