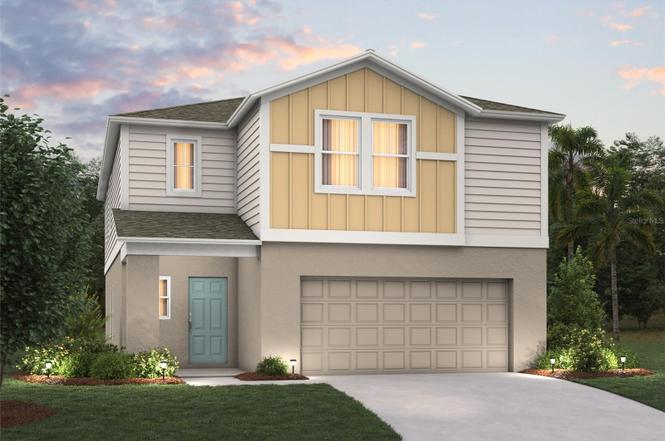
6040 Navona Way
Winter Haven, FL 33884
$357,999F
5 bd · 3.0 ba ·
2,470 sqft ·
Built 2025
· Land
· Pending
· 147 DOM
Cashflow @ list (25.0% down · 7.5%)
Estimated rent
$2,429/mo
Mortgage (P&I)
−$1,877
Tax + insurance
−$597
HOA
−$18
Vac / Maint / Mgmt
−$510
Net cashflow
$-573/mo
Annual
$-6,873/yr
Cap rate
4.37%
Cash-on-cash
-6.86%
DSCR
0.69
1% rule
0.68%
Cash to close
$100,240
Investor read
- This is a 5-bed/3.0-bath land listed at $358k.
- At list price, monthly cash flow is $-573 ($-7k/yr) — negative.
- To cash-flow at today's rent, offer at most $275k (23.2% below list).
- To meet the 1% rule (rent ≥ 1% of price), the offer needs to be $243k (32.1% below list).
- It's been on market 147 days — a 12% lower offer ($315k) is reasonable based on typical stale-listing flexibility.
- Recommended offer: $243k (32.1% below list) — sets the bar for 1% rule.
- Local home prices are declining (-3.0%/yr); year-one equity from $2k of loan paydown is wiped out by about $11k of value loss. Plan a longer hold.
- Location reads 74/100 on livability (#291 in FL, #4,898 nationally) — a middle-class / working-renter tenant base. Strengths: cost of living A+, housing A+, health & safety A; Watch: employment C-, amenities F, commute F.
- Polk (suburban): math 39% / reading 43% proficiency, ranked #62 of 73 in FL (top 85%) — families likely to look elsewhere, expect single-tenant / working-renter base with shorter leases.
- Zoned schools: Pinewood Elementary School (math 48% / reading 40%, grade F, #1,330 of 2,144 statewide, top 63%, 709 students, 53% FRL); Lake Region High School (math 14% / reading 22%, grade F, #570 of 667 statewide, top 86%, 1,545 students, 61% FRL) — zoned schools at 57% FRL track the district average.
- Market conditions: Rents rising (+1.9%/yr); 680 active listings in the ZIP; 17 comparable units currently listed for rent nearby; rentals at typical pace (median 24d on market — plan ~3-4 weeks tenant-placement turnaround); 10,384 units permitted in Polk County in 2024 (1,716 in 5+ unit buildings).
- Polk County population projected at +33% by 2050 — long-run rental-demand tailwind backs the buy-and-hold thesis.
- 2 sale attempts with the ask held roughly flat each time — persistent listings suggest the price (not the market) is what's stuck; bring a comps-based counter.
- Climate carrying-cost: severe wind risk, 99% chance of damaging wind over 30y; moderate wildfire risk; extreme-heat days projected 7→23/yr by 2055 (HVAC capex compounding) — expect insurance premiums to compound above CPI over the hold.
- This rent runs 41% of the median local income ($70k/yr) — at the standard rent-burdened threshold; future hikes will face affordability resistance.
Questions for listing agent
- What do current leases actually rent for vs. the listed asking? Can we see a recent rent roll and the last 12 months of T-12 income?
- It's been on market 147 days. Have you received any prior offers? Is the seller open to a 32% concession, seller financing, or rate buy-down credit?
- What does the HOA fee cover, when was the last increase, and are there any pending special assessments or reserve-fund shortfalls?
- Why hasn't it sold? Are there any deal-killer items the seller is aware of (foundation, flood, title, zoning, code violations)?
- Is there a deadline driving the sale (1031 exchange, divorce, estate, relocation)? That informs how much negotiation room exists.
- The area grade is low — what's the realistic commute time and amenity access for the typical tenant pool here? Any planned neighborhood developments (good or bad) we should know about?
- What's the average days-on-market for RENTAL listings here right now (not sales)? A rising rental-DOM trend means longer vacancies and softer asking-rent achievability than the comps imply.
- What's the recent tenant-quality profile in this submarket — average credit score on applications, eviction rate, late-payment / NSF rate, and stable-employment percentage? A property-management company in the area should have these aggregated.
CashFlowRE · CFR-R7TWKM9H8FRCZR
· Data 2 weeks ago
cashflowre.app · 2026-05-29