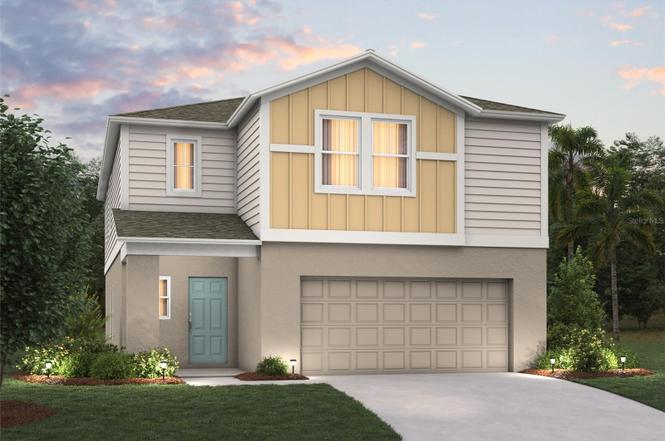
 🏗️ New Construction
6040 Navona Way · Winter Haven, FL
Flood risk 1/10 · Minimal
- FEMA flood zone
- X (unshaded)
- Chance of flooding over 30 yrs
- 0.0%
- Est. flood insurance / yr
- $507 – $1,088
Fire risk 5/10 · Moderate
- Est. fire insurance / yr
- $947 – $1,759
Heat risk 8/10 · Major
- Hot days now (above 108°F)
- 7 days/yr
- Hot days in 30 yrs
- 23 days/yr
Wind risk 10/10 · Severe
- Chance of severe wind over 30 yrs
- 99.0%
Air-quality risk 2/10 · Minimal
- Unhealthy air days now
- 0 days/yr
- Unhealthy air days in 30 yrs
- 2 days/yr
Risk factors via First Street. Map © Google.
Why this score? — see what drove the F grade
The composite is a weighted blend of 9 inputs, each scored 0–100. Each bar is that input's sub-score; the figure is the points it added to the 100-point composite (weight × sub-score).
- ARV discount +7.5/15.0
- Cash flow +6.7/30.0
- Livability +3.7/5.0
- Schools +3.5/10.0
- Rent growth +3.0/5.0
- Condition / age +2.5/5.0
- 1% rule +1.8/10.0
- DSCR +0.9/10.0
- Appreciation +0.0/10.0
$357,999
🖨 Deal sheet 📄 Offer letter ✓ Due diligence
Listing remarks
Under Construction. BELOW MARKET INTEREST RATES with use of Sellers Preferred Lender. Stylish spaces, flexible floor plans, and all the modern amenities—this home is built for your vibe. With quartz countertops throughout, stainless-steel appliances and a smart thermostat for energy efficient climate control, this home is sure to check all your boxes. The front door opens to luxury vinyl plank flooring and soaring ceilings that flows seamlessly to the main living areas. Off the foyer is a secluded in-law suite, providing privacy and comfort for family or visitors. The sliding glass doors off the kitchen offer an easy escape to the Florida sunshine. The second floor features the additi
Key facts
- Quartz countertops
- Soaring ceilings
- Smart thermostat
Tags
Neighborhood map
What this means for you Summary
Snapshot
- This is a 5-bed/3.0-bath land listed at $358k.
Deal economics
- At list price, monthly cash flow is $-573 ($-7k/yr) — negative.
- To cash-flow at today's rent, offer at most $275k (23.2% below list).
- To meet the 1% rule (rent ≥ 1% of price), the offer needs to be $243k (32.1% below list).
- Recommended offer: $243k (32.1% below list) — sets the bar for 1% rule.
Location & tenants
- Location reads 74/100 on livability (#291 in FL, #4,898 nationally) — a middle-class / working-renter tenant base. Strengths: cost of living A+, housing A+, health & safety A; Watch: employment C-, amenities F, commute F.
- Polk (suburban): math 39% / reading 43% proficiency, ranked #62 of 73 in FL (top 85%) — families likely to look elsewhere, expect single-tenant / working-renter base with shorter leases.
- Zoned schools: Pinewood Elementary School (math 48% / reading 40%, grade F, #1,330 of 2,144 statewide, top 63%, 709 students, 53% FRL); Lake Region High School (math 14% / reading 22%, grade F, #570 of 667 statewide, top 86%, 1,545 students, 61% FRL) — zoned schools at 57% FRL track the district average.
- Market conditions: Rents rising (+1.9%/yr); 680 active listings in the ZIP; 17 comparable units currently listed for rent nearby; rentals at typical pace (median 24d on market — plan ~3-4 weeks tenant-placement turnaround); 10,384 units permitted in Polk County in 2024 (1,716 in 5+ unit buildings).
- This rent runs 41% of the median local income ($70k/yr) — at the standard rent-burdened threshold; future hikes will face affordability resistance.
Forward outlook
- Local home prices are declining (-3.0%/yr); year-one equity from $2k of loan paydown is wiped out by about $11k of value loss. Plan a longer hold.
- Polk County population projected at +33% by 2050 — long-run rental-demand tailwind backs the buy-and-hold thesis.
Negotiation context
- It's been on market 147 days — a 12% lower offer ($315k) is reasonable based on typical stale-listing flexibility.
- 2 sale attempts with the ask held roughly flat each time — persistent listings suggest the price (not the market) is what's stuck; bring a comps-based counter.
Risks & watch-outs
- Climate carrying-cost: severe wind risk, 99% chance of damaging wind over 30y; moderate wildfire risk; extreme-heat days projected 7→23/yr by 2055 (HVAC capex compounding) — expect insurance premiums to compound above CPI over the hold.
Questions for the listing agent
- What do current leases actually rent for vs. the listed asking? Can we see a recent rent roll and the last 12 months of T-12 income?
- It's been on market 147 days. Have you received any prior offers? Is the seller open to a 32% concession, seller financing, or rate buy-down credit?
- What does the HOA fee cover, when was the last increase, and are there any pending special assessments or reserve-fund shortfalls?
- Why hasn't it sold? Are there any deal-killer items the seller is aware of (foundation, flood, title, zoning, code violations)?
- Is there a deadline driving the sale (1031 exchange, divorce, estate, relocation)? That informs how much negotiation room exists.
- The area grade is low — what's the realistic commute time and amenity access for the typical tenant pool here? Any planned neighborhood developments (good or bad) we should know about?
- What's the average days-on-market for RENTAL listings here right now (not sales)? A rising rental-DOM trend means longer vacancies and softer asking-rent achievability than the comps imply.
- What's the recent tenant-quality profile in this submarket — average credit score on applications, eviction rate, late-payment / NSF rate, and stable-employment percentage? A property-management company in the area should have these aggregated.
- How much new for-sale + rental construction is in the pipeline within 1–3 miles? Heavy new supply typically softens prices + rents 12–24 months out; constrained supply supports both.
Investment metrics
- 1% rule
- 0.68% ✗
- Cap rate
- 4.37%
- Cash-on-cash
- -6.86%
- DSCR
- 0.69
- GRM
- 12.3
CMA / ARV
No comps found within radius.
Projected returns pro-forma
-3.0% appreciation · 1.9% rent growth · sell at horizon
- IRR
- -29.4%
- Equity multiple
- 0.03×
- Total profit
- $-97,104
- Equity at exit
- $53,379
- IRR
- -35.2%
- Equity multiple
- -0.42×
- Total profit
- $-142,013
- Equity at exit
- $30,953
Cash invested: $100,240 (down + closing). Projections, not guarantees.
Landlord ↔ Tenant lean methodology
- Overall (STATE)
- 87 Strongly Landlord-Friendly
- State Florida
- 87 Strongly Landlord-Friendly · R+3
- County
- — inherits STATE
- City
- — inherits STATE
ZIP-level market 33884
- Home prices YoY
- -34.1%
- Rents YoY
- 1.9%
- Active inventory
- 680
- Price-to-rent
- 12.3×
Monthly cashflow live
- Estimated rent
- $2,429 high interval (Pro) →
- Mortgage (P&I)
- −$1,877
- Tax est. 1.5%
- −$447 /mo · $5,370/yr
- Insurance
- −$149
- HOA
- −$18
- Vacancy / Maint / Mgmt
- −$510
- Net cashflow
- $-573
Break-even live
UW: 25.0% down · 7.5% · 30yr · 1.5% tax · 5.0% vac · 8.0% maint · 8.0% mgmt
Financing live
Cash to close
- Down payment
- $89,500
- Closing costs
- $10,740
- Reserves months
- —
- Total cash needed
- —
Loan-product check · same deal, 3 products live
Conventional
25% down · 7.5% · 30yr
- Down + closing
- —
- Monthly P&I
- —
- Monthly cashflow
- —
- DSCR
- —
- Eligible?
- —
Personal DTI + credit; lowest rate.
DSCR
20% down · 8.5% · 30yr
- Down + closing
- —
- Monthly P&I
- —
- Monthly cashflow
- —
- DSCR
- —
- Eligible?
- —
No personal income docs; deal must DSCR.
Hard money
10% down · 12.0% · 12mo
- Down + closing
- —
- Monthly P&I
- —
- Monthly cashflow
- —
- DSCR
- —
- Eligible?
- —
Short-term bridge; refi at stabilization.
Rent comps 17 comps
| Address | Beds | Baths | Sqft | Rent | $/sqft | DOM | Units | Dist |
|---|---|---|---|---|---|---|---|---|
| 6472 Domizio Dr Winter Haven, FL | 5.0 | 2.5 | 2112 | $2,300 | $1.09 | 23d | 1 | 0.16mi |
| 6428 Domizio Dr Winter Haven, FL | 5.0 | 2.5 | 2112 | $2,200 | $1.04 | 23d | 1 | 0.22mi |
| 6204 Botticella Blvd Winter Haven, FL | 5.0 | 2.5 | 2280 | $2,350 | $1.03 | 3d | 1 | 0.23mi |
| 3511 Costello Cir Winter Haven, FL | 4.0 | 2.0 | 2234 | $2,100 | $0.94 | 23d | 1 | 0.34mi |
| 3412 Costello Cir Winter Haven, FL | 5.0 | 3.0 | 2540 | $2,500 | $0.98 | 23d | 1 | 0.41mi |
| 4506 Rapallo Ave Winter Haven, FL | 4.0 | 2.0 | 1754 | $1,899 | $1.08 | 23d | 1 | 0.47mi |
| 2772 San Marco Way Winter Haven, FL | 4.0 | 3.0 | 1988 | $2,200 | $1.11 | 23d | 1 | 0.50mi |
| 4442 Rapallo Ave Winter Haven, FL | 4.0 | 2.0 | 1607 | $1,895 | $1.18 | 23d | 1 | 0.56mi |
| 2107 Cartgate Ln Winter Haven, FL | 4.0 | 3.0 | 2217 | $2,600 | $1.17 | 23d | 1 | 0.77mi |
| 2116 Cartgate Ln Winter Haven, FL | 4.0 | 3.0 | 2217 | $2,500 | $1.13 | 23d | 1 | 0.77mi |
| 632 Vittorio Dr Winter Haven, FL | 4.0 | 2.0 | 1597 | $1,895 | $1.19 | 23d | 1 | 0.82mi |
| 1310 Benevento Dr Winter Haven, FL | 4.0 | 2.0 | 1964 | $2,500 | $1.27 | 23d | 1 | 0.88mi |
| 1343 Benevento Dr Winter Haven, FL | 4.0 | 2.0 | 1849 | $2,000 | $1.08 | 14d | 1 | 0.90mi |
| 810 Terranova Rd Winter Haven, FL | 4.0 | 2.0 | 2056 | $1,900 | $0.92 | 23d | 1 | 1.01mi |
| 397 Corso Loop Winter Haven, FL | 4.0 | 2.0 | 1851 | $2,395 | $1.29 | 3d | 1 | 1.04mi |
| 850 Terranova Rd Winter Haven, FL | 4.0 | 2.0 | 1770 | $2,176 | $1.23 | 3d | 1 | 1.04mi |
| 554 Reddicks Cir Winter Haven, FL | 4.0 | 2.0 | 2000 | $2,000 | $1.00 | 10d | 1 | 1.12mi |
HOA detail
- Monthly dues
- $18 · $216/yr
Listing history 18 events
-
2026-03-27status Pending
-
2026-03-24status Active
-
2026-03-24price $357,999
-
2026-02-16status Pending
-
2026-02-10price $342,999
-
2026-02-04price $339,999
-
2026-01-27price $342,499
-
2026-01-21price $342,999
-
2026-01-14price $342,499
-
2026-01-07price $344,499
-
2025-12-19price $342,499
-
2025-12-10price $338,999
-
2025-11-12price $339,999
-
2025-10-23price $344,999
-
2025-10-01price $354,999
-
2025-09-26price $358,999
-
2025-09-25$362,190 Active
-
2025-04-21soldstatus $670,000
ⓘ Source: listings_history table (triggers on properties + properties_extension) + one-shot
backfill from property_details.listing_events for pre-trigger history.
Climate risk First Street
- Flood 1/10 Low FEMA zone X (unshaded) · 0% chance over 30 yrs
- Wildfire 5/10 Major
- Heat 8/10 Severe 7 d/yr ≥108°F today · 23 d/yr by 30 yrs out
- Wind 10/10 Extreme 99% chance of damaging wind over 30 yrs
- Air quality 2/10 Low 0 unhealthy d/yr today · 2 by 30 yrs out
Nearby sold comps map
Loading sold comps map…
Walkable amenities ~0.75 mi
Loading nearby amenities…
Taxation est. · year 1
- Rental income
- $29,153
- − Mortgage interest
- −$20,054
- − Property taxes
- −$5,370
- − Insurance
- −$1,790
- − Repairs & maintenance
- −$2,332
- − Management
- −$2,332
- − HOA
- −$216
- − Depreciation
- −$10,415
- Taxable loss
- −$13,355
- Est. tax savings @ 24.0%
- +$3,205
- After-tax cash flow
- $-3,668/yr
For passive investors: Depreciation is non-cash, so a rental often shows a tax loss while cash-flowing — sheltering income. Rental losses are passive: they offset passive income freely, and up to $25,000/yr can offset ordinary (W-2) income if you actively participate and your MAGI is under $100k (phasing out to $0 by $150k); unused losses carry forward. On sale, claimed depreciation is recaptured at up to 25%, and gains may owe capital-gains tax (a 1031 exchange can defer both). Figures are a year-1 estimate at your 24.0% rate — not tax advice; consult a CPA.
Schools (NCES district)
- District
- Polk
- NCES district ID
- 1201590
- Math proficiency
- 39% ▼ -11.00%
- Reading proficiency
- 43% ▼ -4.00%
- Median HH income
- $43,979
- Composite
- 34.74/100
- National rank
- #5132
- State rank
- #62 of 73 in FL
Livability — Winter Haven
- Score
- 74/100
- State rank
- #291
- US rank
- #4898
Category grades
Schools grade is shown separately in the Schools card above.
Census & demographics
- Census place
- Winter Haven, FL
- County
- Polk County · 740,051 people
- City population
- 121,740
- Metro
- Lakeland-Winter Haven, FL
- Population (ZIP)
- 37,561
- Household income
- $70,443
- Rent vs Own
- Severe rent burden
- 949.0
Population outlook (Polk County) Hauer SSP2
- Today (2025)
- 752,975 people
- By 2030
- 804,621 · +6.9%
- By 2040
- 906,117 · +20.3%
- By 2050
- 1,000,476 · +32.9%
- By 2075
- 1,197,520 · +59.0%
- By 2100
- 1,271,518 · +68.9%
Race, ethnicity, and origin ACS 2023
- Neighborhood character
- Diverse neighborhood (Simpson 0.55)
- Race & ethnicity
- White 63% Hispanic / Latino 19% Black 14% Two or more races 7% Asian 2%
- Hispanic origin (detail)
- Mexican 2% Puerto Rican 10% Cuban 2%
- Common ancestry
- Romanian 2% Lithuanian 2% Hispanic 2%
- Foreign-born
- 7% · Canada, Jamaica
- Languages at home
- 84% English-only · Spanish 12% French/Haitian/Cajun 1% Other Indo-European 1%
Political lean MEDSL · Polk
- 2024 margin
- Strong R (+20.7) · D 39.2% · R 59.9%
- 2008→2024 swing
- -14.6pp toward R · 2008: -6.1pp · 2024: -20.7pp
- All cycles
- 2024: R+20.7 2020: R+14.4 2016: R+14.1 2012: R+6.8 2008: R+6.1
Not yet ingested
- Civics
- —
Market trends
- HPI YoY
- ▼ -134.69%
- Current HPI
- 260.1421
- Rent YoY
- ▲ 1.90%
- Metro
- Lakeland-Winter Haven, FL
- State GDP YoY
- ▲ 3.28%
- F500 in state
- 36
Industry mix (Fortune 500 HQ in FL)
| Industry | F500 HQs | Revenue |
|---|---|---|
| Industrial Technology | 2 | $29B |
|
||
| Insurance | 2 | $17B |
|
||
| Retail | 1 | $60B |
|
||
| Technology Distribution | 1 | $58B |
|
||
| Homebuilding | 1 | $35B |
|
||
| Technology Manufacturing | 1 | $35B |
|
||
Price history
-46.6% since first listed18 events — show timeline
- 2026-03-27 Pending — Stellar MLS as Distributed by MLS Grid
- 2026-03-24 Relisted — Stellar MLS as Distributed by MLS Grid
- 2026-03-24 Price Changed $357,999 Stellar MLS as Distributed by MLS Grid
- 2026-02-16 Pending — Stellar MLS as Distributed by MLS Grid
- 2026-02-10 Price Changed $342,999 Stellar MLS as Distributed by MLS Grid
- 2026-02-04 Price Changed $339,999 Stellar MLS as Distributed by MLS Grid
- 2026-01-27 Price Changed $342,499 Stellar MLS as Distributed by MLS Grid
- 2026-01-21 Price Changed $342,999 Stellar MLS as Distributed by MLS Grid
- 2026-01-14 Price Changed $342,499 Stellar MLS as Distributed by MLS Grid
- 2026-01-07 Price Changed $344,499 Stellar MLS as Distributed by MLS Grid
- 2025-12-19 Price Changed $342,499 Stellar MLS as Distributed by MLS Grid
- 2025-12-10 Price Changed $338,999 Stellar MLS as Distributed by MLS Grid
- 2025-11-12 Price Changed $339,999 Stellar MLS as Distributed by MLS Grid
- 2025-10-23 Price Changed $344,999 Stellar MLS as Distributed by MLS Grid
- 2025-10-01 Price Changed $354,999 Stellar MLS as Distributed by MLS Grid
- 2025-09-26 Price Changed $358,999 Stellar MLS as Distributed by MLS Grid
- 2025-09-25 Listed $362,190 Stellar MLS as Distributed by MLS Grid
- 2025-04-21 Sold (Public Records) $670,000 Public Records
Cash-flow waterfall
monthlySold comps — $/sqft
last 12 mo · ≤1 miLoading sold comps…