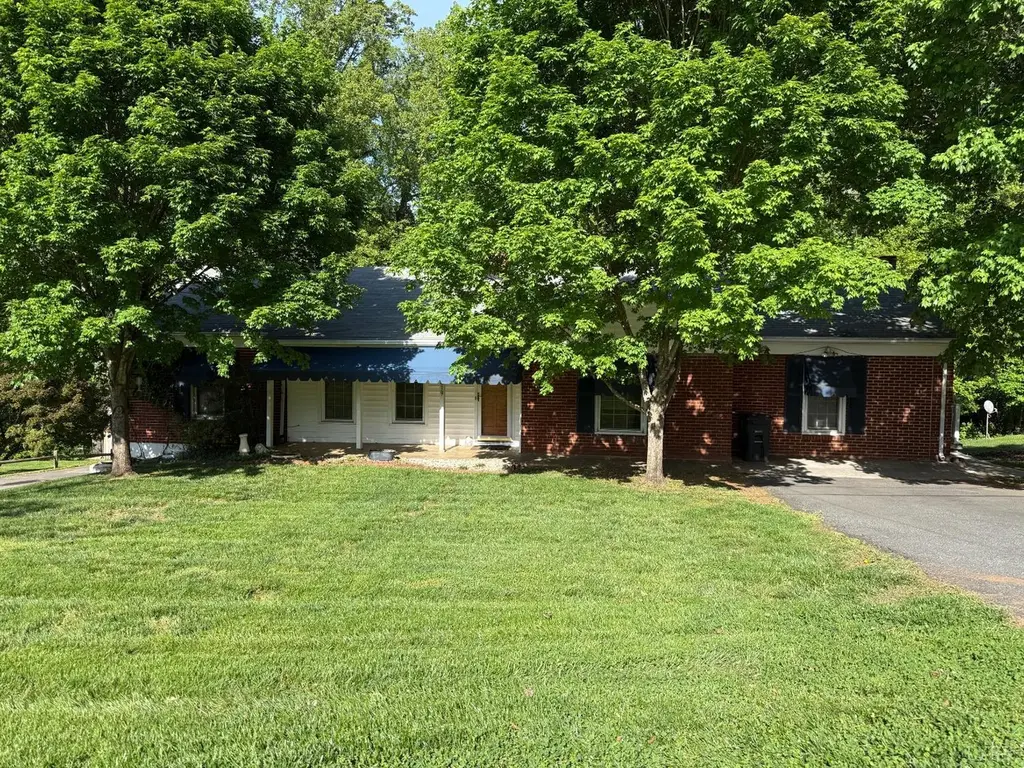
3819 Moorman Dr
Lynchburg, VA 24501
$255,000F
1 bd · 2.5 ba ·
2,530 sqft ·
Built 1954
· SingleFamily
· Active
· 45 DOM
Cashflow @ list (25.0% down · 7.5%)
Estimated rent
$1,061/mo
Mortgage (P&I)
−$1,337
Tax + insurance
−$270
HOA
−$0
Vac / Maint / Mgmt
−$223
Net cashflow
$-770/mo
Annual
$-9,236/yr
Cap rate
2.67%
Cash-on-cash
-12.94%
DSCR
0.42
1% rule
0.42%
Cash to close
$71,400
Investor read
- This is a 1-bed/2.5-bath single-family listed at $255k.
- At list price, monthly cash flow is $-770 ($-9k/yr) — negative.
- To cash-flow at today's rent, offer at most $119k (53.3% below list).
- To meet the 1% rule (rent ≥ 1% of price), the offer needs to be $106k (58.4% below list).
- It's been on market 45 days — a 3% lower offer ($247k) is reasonable based on typical stale-listing flexibility.
- Recommended offer: $106k (58.4% below list) — sets the bar for 1% rule.
- Local home prices are declining (-3.0%/yr); year-one equity from $2k of loan paydown is wiped out by about $8k of value loss. Plan a longer hold.
- Location reads 91/100 on livability (#1 in VA, #58 nationally) — a professional / high-income tenant draw. Strengths: amenities A+, commute A+, cost of living A+; Watch: crime C-, employment D+.
- Lynchburg City Public School District (urban): math 36% / reading 61% proficiency, ranked #104 of 131 in VA (top 79%) — families likely to look elsewhere, expect single-tenant / working-renter base with shorter leases; 61% free/reduced lunch — lower-income household profile, screen leases tightly.
- Zoned schools: Perrymont Elementary (math 27% / reading 42%, grade F, #966 of 1,108 statewide, top 89%, 337 students, 95% FRL); Paul Laurence Dunbar Middle For Innovation (math 37% / reading 66%, grade C, #222 of 342 statewide, top 65%, 531 students, 95% FRL); E.C. Glass High (math 42% / reading 84%, grade B-, #223 of 319 statewide, top 70%, 1,325 students, 92% FRL) — zoned schools average 94% FRL vs 61% district-wide (33 pts higher); higher-poverty schools than district average — tighter screening recommended.
- Watch-outs: built in 1954 — expect roof / HVAC / electrical / plumbing capex.
- Market conditions: Rents rising (+1.1%/yr); 221 active listings in the ZIP; lower-income renter base — watch delinquency; 472 units permitted in Lynchburg city in 2024 (240 in 5+ unit buildings).
- Lynchburg County population projected at +37% by 2050 — long-run rental-demand tailwind backs the buy-and-hold thesis.
- Current owner paid $18k; list at $255k implies a 1317% gain — meaningful room to come down on a strong offer.
- Climate carrying-cost: extreme-heat days projected 7→18/yr by 2055 (HVAC capex compounding) — expect insurance premiums to compound above CPI over the hold.
- Cap rate 2.7% vs local median 4.0% in Lynchburg — below-typical yield; the buyer is paying a premium for something (appreciation thesis, condition, location) that the cap rate doesn't capture.
- This rent runs 30% of the median local income ($42k/yr) — at the standard rent-burdened threshold; future hikes will face affordability resistance.
Questions for listing agent
- What do current leases actually rent for vs. the listed asking? Can we see a recent rent roll and the last 12 months of T-12 income?
- It's been on market 45 days. Have you received any prior offers? Is the seller open to a 58% concession, seller financing, or rate buy-down credit?
- Built in 1954 — when were the roof, HVAC, electrical panel, plumbing, and water heater last replaced?
- Is there a deadline driving the sale (1031 exchange, divorce, estate, relocation)? That informs how much negotiation room exists.
- Schools are A-rated — typically a magnet for longer-tenancy family renters. What's the average tenant stay here, and is there a school-zone premium baked into asking?
- The area grade is low — what's the realistic commute time and amenity access for the typical tenant pool here? Any planned neighborhood developments (good or bad) we should know about?
- What's the average days-on-market for RENTAL listings here right now (not sales)? A rising rental-DOM trend means longer vacancies and softer asking-rent achievability than the comps imply.
- What's the recent tenant-quality profile in this submarket — average credit score on applications, eviction rate, late-payment / NSF rate, and stable-employment percentage? A property-management company in the area should have these aggregated.
CashFlowRE · CFR-R8BHN8B8PNKNH8
· Data 1 day ago
cashflowre.app · 2026-05-29