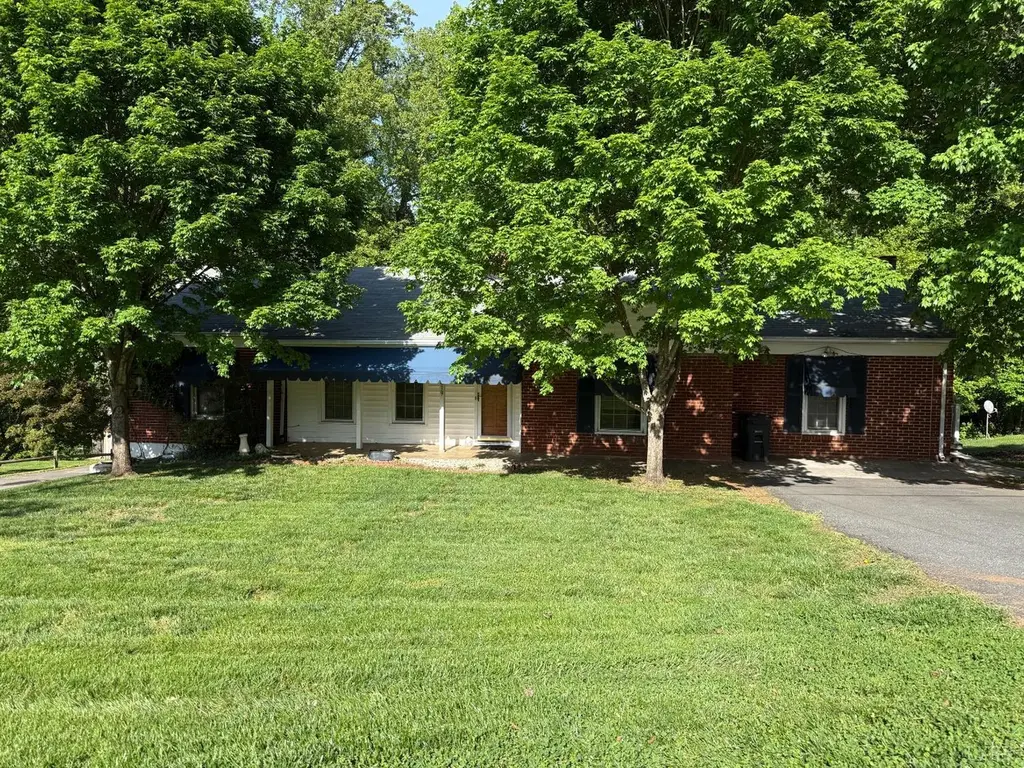
3819 Moorman Dr · Lynchburg, VA
Flood risk 1/10 · Minimal
- FEMA flood zone
- X (unshaded)
- Chance of flooding over 30 yrs
- 0.0%
- Est. flood insurance / yr
- $473 – $860
Fire risk 1/10 · Minimal
- Est. fire insurance / yr
- $666 – $1,236
Heat risk 5/10 · Moderate
- Hot days now (above 102°F)
- 7 days/yr
- Hot days in 30 yrs
- 18 days/yr
Wind risk 2/10 · Minimal
- Chance of severe wind over 30 yrs
- 3.0%
Air-quality risk 2/10 · Minimal
- Unhealthy air days now
- 0 days/yr
- Unhealthy air days in 30 yrs
- 1 days/yr
Risk factors via First Street. Map © Google.
Why this score? — see what drove the F grade
The composite is a weighted blend of 9 inputs, each scored 0–100. Each bar is that input's sub-score; the figure is the points it added to the 100-point composite (weight × sub-score).
- ARV discount +15.0/15.0
- Livability +4.5/5.0
- Schools +4.0/10.0
- Cash flow +3.5/30.0
- Rent growth +2.8/5.0
- Condition / age +2.5/5.0
- 1% rule +0.0/10.0
- DSCR +0.0/10.0
- Appreciation +0.0/10.0
$255,000
🖨 Deal sheet (PDF) 📄 Offer letter ✓ Due diligence
Listing remarks
Brick ranch located off of Lakeside Dr. Two separate electric meters with a full one bedroom apartment in the basement. Property being sold "As is. "
Key facts
- Lakeside dr
- Brick ranch
- 0.45 acre lot
Tags
Property features AI
Exterior
- Parking: Off-street parking
- Utilities: Public water; Septic tank
- Home design: Single-family residence; One-story
- Construction: Brick and vinyl siding construction
- Exterior features: Shingle roof; Workshop on property
Interior
- Kitchen: Dishwasher; Electric range; Refrigerator
- Flooring: Hardwood; Wood
- Bathrooms: 2 full bathrooms; 1 half bathroom
- Heating & cooling: Heat pump
- Interior features: Two fireplaces; Finished walk-out basement; Basement laundry room
- Laundry & utility: Laundry room in basement; Electric water heater
Neighborhood map
What this means for you Summary
Snapshot
- This is a 1-bed/2.5-bath single-family listed at $255k.
Deal economics
- At list price, monthly cash flow is $-770 ($-9k/yr) — negative.
- To cash-flow at today's rent, offer at most $119k (53.3% below list).
- To meet the 1% rule (rent ≥ 1% of price), the offer needs to be $106k (58.4% below list).
- Recommended offer: $106k (58.4% below list) — sets the bar for 1% rule.
- Cap rate 2.7% vs local median 4.0% in Lynchburg — below-typical yield; the buyer is paying a premium for something (appreciation thesis, condition, location) that the cap rate doesn't capture.
Location & tenants
- Location reads 91/100 on livability (#1 in VA, #58 nationally) — a professional / high-income tenant draw. Strengths: amenities A+, commute A+, cost of living A+; Watch: crime C-, employment D+.
- Lynchburg City Public School District (urban): math 36% / reading 61% proficiency, ranked #104 of 131 in VA (top 79%) — families likely to look elsewhere, expect single-tenant / working-renter base with shorter leases; 61% free/reduced lunch — lower-income household profile, screen leases tightly.
- Zoned schools: Perrymont Elementary (math 27% / reading 42%, grade F, #966 of 1,108 statewide, top 89%, 337 students, 95% FRL); Paul Laurence Dunbar Middle For Innovation (math 37% / reading 66%, grade C, #222 of 342 statewide, top 65%, 531 students, 95% FRL); E.C. Glass High (math 42% / reading 84%, grade B-, #223 of 319 statewide, top 70%, 1,325 students, 92% FRL) — zoned schools average 94% FRL vs 61% district-wide (33 pts higher); higher-poverty schools than district average — tighter screening recommended.
- Market conditions: Rents rising (+1.1%/yr); 221 active listings in the ZIP; lower-income renter base — watch delinquency; 472 units permitted in Lynchburg city in 2024 (240 in 5+ unit buildings).
- This rent runs 30% of the median local income ($42k/yr) — at the standard rent-burdened threshold; future hikes will face affordability resistance.
Forward outlook
- Local home prices are declining (-3.0%/yr); year-one equity from $2k of loan paydown is wiped out by about $8k of value loss. Plan a longer hold.
- Lynchburg County population projected at +37% by 2050 — long-run rental-demand tailwind backs the buy-and-hold thesis.
Negotiation context
- It's been on market 45 days — a 3% lower offer ($247k) is reasonable based on typical stale-listing flexibility.
- Current owner paid $18k; list at $255k implies a 1317% gain — meaningful room to come down on a strong offer.
Risks & watch-outs
- Watch-outs: built in 1954 — expect roof / HVAC / electrical / plumbing capex.
- Climate carrying-cost: extreme-heat days projected 7→18/yr by 2055 (HVAC capex compounding) — expect insurance premiums to compound above CPI over the hold.
Questions for the listing agent
- What do current leases actually rent for vs. the listed asking? Can we see a recent rent roll and the last 12 months of T-12 income?
- It's been on market 45 days. Have you received any prior offers? Is the seller open to a 58% concession, seller financing, or rate buy-down credit?
- Built in 1954 — when were the roof, HVAC, electrical panel, plumbing, and water heater last replaced?
- Is there a deadline driving the sale (1031 exchange, divorce, estate, relocation)? That informs how much negotiation room exists.
- Schools are A-rated — typically a magnet for longer-tenancy family renters. What's the average tenant stay here, and is there a school-zone premium baked into asking?
- The area grade is low — what's the realistic commute time and amenity access for the typical tenant pool here? Any planned neighborhood developments (good or bad) we should know about?
- What's the average days-on-market for RENTAL listings here right now (not sales)? A rising rental-DOM trend means longer vacancies and softer asking-rent achievability than the comps imply.
- What's the recent tenant-quality profile in this submarket — average credit score on applications, eviction rate, late-payment / NSF rate, and stable-employment percentage? A property-management company in the area should have these aggregated.
- How much new for-sale + rental construction is in the pipeline within 1–3 miles? Heavy new supply typically softens prices + rents 12–24 months out; constrained supply supports both.
Investment metrics
- 1% rule
- 0.42% ✗
- Cap rate
- 2.67%
- Cash-on-cash
- -12.94%
- DSCR
- 0.42
- GRM
- 20.0
CMA / ARV
- ARV (median comp)
- $330,401
- List price
- $255,000
- Delta
- -22.82%
- Verdict
- UNDERPRICED
- Comps
- 20 within 1.0 mi
Projected returns pro-forma
-3.0% appreciation · 1.15% rent growth · sell at horizon
- IRR
- -42.2%
- Equity multiple
- -0.29×
- Total profit
- $-92,360
- Equity at exit
- $38,021
- IRR
- -83.2%
- Equity multiple
- -1.12×
- Total profit
- $-151,534
- Equity at exit
- $22,048
Cash invested: $71,400 (down + closing). Projections, not guarantees.
Landlord ↔ Tenant lean methodology
- Overall (STATE)
- 55 Moderately Landlord-Leaning
- State Virginia
- 55 Moderately Landlord-Leaning · D+2
- County
- — inherits STATE
- City
- — inherits STATE
ZIP-level market 24501
- Rents YoY
- 1.1%
- Active inventory
- 221
- Price-to-rent
- 20.0×
Monthly cashflow live
- Estimated rent
- $1,061 medium interval (Pro) →
- Mortgage (P&I)
- −$1,337
- Tax from tax record
- −$164 /mo · $1,971/yr
- Insurance
- −$106
- HOA
- −$0
- Vacancy / Maint / Mgmt
- −$223
- Net cashflow
- $-770
Break-even live
Sensitivity live
| Price | -10% $-625 | -5% $-697 | +0% $-770 | +5% $-842 | +10% $-914 |
|---|---|---|---|---|---|
| Rent | -10% $-853 | -5% $-812 | +0% $-770 | +5% $-728 | +10% $-686 |
| Rate | -1.0pp $-641 | -0.5pp $-705 | base $-770 | +0.5pp $-836 | +1.0pp $-903 |
UW: 25.0% down · 7.5% · 30yr · 1.5% tax · 5.0% vac · 8.0% maint · 8.0% mgmt
Financing live
Cash to close
- Down payment
- $63,750
- Closing costs
- $7,650
- Reserves months
- —
- Total cash needed
- —
Loan-product check · same deal, 3 products live
Conventional
25% down · 7.5% · 30yr
- Down + closing
- —
- Monthly P&I
- —
- Monthly cashflow
- —
- DSCR
- —
- Eligible?
- —
Personal DTI + credit; lowest rate.
DSCR
20% down · 8.5% · 30yr
- Down + closing
- —
- Monthly P&I
- —
- Monthly cashflow
- —
- DSCR
- —
- Eligible?
- —
No personal income docs; deal must DSCR.
Hard money
10% down · 12.0% · 12mo
- Down + closing
- —
- Monthly P&I
- —
- Monthly cashflow
- —
- DSCR
- —
- Eligible?
- —
Short-term bridge; refi at stabilization.
Listing history 20 events
-
2026-06-21days on market $255,000 Active 45 DOM
-
2026-06-19days on market $255,000 Active 43 DOM
-
2026-06-18days on market $255,000 Active 42 DOM
-
2026-06-17days on market $255,000 Active 41 DOM
-
2026-06-16days on market $255,000 Active 40 DOM
-
2026-06-15days on market $255,000 Active 39 DOM
-
2026-06-14days on market $255,000 Active 37 DOM
-
2026-06-13days on market $255,000 Active 36 DOM
-
2026-06-10days on market $255,000 Active 34 DOM
-
2026-06-09days on market $255,000 Active 33 DOM
-
2026-06-08days on market $255,000 Active 32 DOM
-
2026-06-07days on market $255,000 Active 31 DOM
-
2026-06-03pricedays on market $255,000 Active 27 DOM
-
2026-06-02days on market $259,900 Active 26 DOM
-
2026-06-01days on market $259,900 Active 25 DOM
-
2026-05-31days on market $259,900 Active 24 DOM
-
2026-05-30days on market $259,900 Active 23 DOM
-
2026-05-05$259,900 Active 159-char remark
-
1964-03-27soldstatus $18,000
-
1959-01-06soldstatus $18,200
ⓘ Source: listings_history table (triggers on properties + properties_extension) + one-shot
backfill from property_details.listing_events for pre-trigger history.
Tax reassessment forecast VA · Resets to sale price
- Current annual tax
- $1,971 · $164/mo
- Projected year-2 tax
- $2,091 · $174/mo
- Expected delta
- +$120/yr (+$10/mo · 6.1%)
ⓘ Screening estimate from a state-policy table — verify with the county assessor before closing.
Climate risk First Street
- Flood 1/10 Low FEMA zone X (unshaded) · 0% chance over 30 yrs
- Wildfire 1/10 Low
- Heat 5/10 Major 7 d/yr ≥102°F today · 18 d/yr by 30 yrs out
- Wind 2/10 Low 3% chance of damaging wind over 30 yrs
- Air quality 2/10 Low 0 unhealthy d/yr today · 1 by 30 yrs out
Nearby sold comps map
Loading sold comps map…
Walkable amenities ~0.75 mi
Loading nearby amenities…
Taxation est. · year 1
- Rental income
- $12,730
- − Mortgage interest
- −$14,284
- − Property taxes
- −$1,971
- − Insurance
- −$1,275
- − Repairs & maintenance
- −$1,018
- − Management
- −$1,018
- − Depreciation
- −$7,418
- Taxable loss
- −$14,255
- Est. tax savings @ 24.0%
- +$3,421
- After-tax cash flow
- $-5,815/yr
For passive investors: Depreciation is non-cash, so a rental often shows a tax loss while cash-flowing — sheltering income. Rental losses are passive: they offset passive income freely, and up to $25,000/yr can offset ordinary (W-2) income if you actively participate and your MAGI is under $100k (phasing out to $0 by $150k); unused losses carry forward. On sale, claimed depreciation is recaptured at up to 25%, and gains may owe capital-gains tax (a 1031 exchange can defer both). Figures are a year-1 estimate at your 24.0% rate — not tax advice; consult a CPA.
Schools (NCES district)
- District
- Lynchburg City Public School District
- NCES district ID
- 5102340
- Math proficiency
- 36% ▼ -38.00%
- Reading proficiency
- 61% ▼ -8.00%
- Median HH income
- $39,097
- Composite
- 40.4/100
- National rank
- #3730
- State rank
- #104 of 131 in VA
Livability — Lynchburg
- Score
- 91/100
- State rank
- #1
- US rank
- #58
Category grades
Schools grade is shown separately in the Schools card above.
Census & demographics
- Census place
- Lynchburg, VA
- County
- Lynchburg City · 97,036 people
- City population
- 97,036
- Metro
- Lynchburg, VA
- Population (ZIP)
- 25,006
- Household income
- $42,222
- Rent vs Own
- Severe rent burden
- 1717.0
Population outlook (Lynchburg County) Hauer SSP2
- Today (2025)
- 87,977 people
- By 2030
- 93,626 · +6.4%
- By 2040
- 106,145 · +20.7%
- By 2050
- 120,783 · +37.3%
- By 2075
- 162,249 · +84.4%
- By 2100
- 191,358 · +117.5%
Race, ethnicity, and origin ACS 2023
- Neighborhood character
- Diverse neighborhood (Simpson 0.55)
- Race & ethnicity
- White 58% Black 34% Two or more races 4% Hispanic / Latino 3%
- Common ancestry
- Slovak 1% Italian 1% Serbian 1%
- Foreign-born
- 3% · Canada
- Languages at home
- 96% English-only · Spanish 2%
Political lean MEDSL · Lynchburg
- 2024 margin
- Lean R (+7.9) · D 45.4% · R 53.3% · Other 1.3%
- 2008→2024 swing
- -3.9pp toward R · 2008: -4.0pp · 2024: -7.9pp
- All cycles
- 2024: R+7.9 2020: D+2.6 2016: R+9.0 2012: R+10.6 2008: R+4.0
Not yet ingested
- Civics
- —
Market trends
- HPI YoY
- ▼ -131.06%
- Current HPI
- 223.6839
- Rent YoY
- ▲ 1.15%
- Metro
- Lynchburg, VA
- State GDP YoY
- ▲ 2.40%
- F500 in state
- 50
Industry mix (Fortune 500 HQ in VA)
| Industry | F500 HQs | Revenue |
|---|---|---|
| Aerospace / Defense | 4 | $236B |
|
||
| Technology / Defense | 3 | $32B |
|
||
| Financial Services | 2 | $176B |
|
||
| Utilities | 2 | $27B |
|
||
| Insurance | 2 | $25B |
|
||
| Technology | 2 | $15B |
|
||
Price history
+1301.1% since first listed4 events — show timeline
- 2026-06-03 Price Changed $255,000 LMLS
- 2026-05-05 Listed $259,900 LMLS
- 1964-03-27 Sold (Public Records) $18,000 Public Records
- 1959-01-06 Sold (Public Records) $18,200 Public Records
Property tax history
+3.4%/yrLatest (2025): $1,971 · +12.3% YoY. Source: county tax records.
Cash-flow waterfall
monthlySold comps — $/sqft
last 12 mo · ≤1 miLoading sold comps…