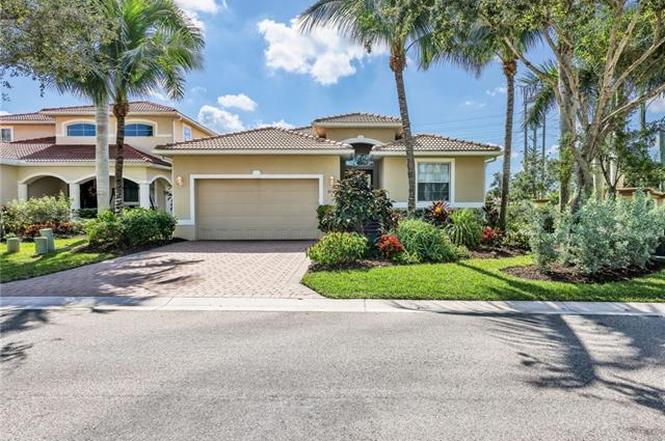
8753 Banyan Bay Blvd
Harlem Heights, FL 33908
$379,000B+
3 bd · 2.0 ba ·
1,998 sqft ·
Built 2012
· SingleFamily
· Active
· 235 DOM
Cashflow @ list (25.0% down · 7.5%)
Estimated rent
$5,056/mo
Mortgage (P&I)
−$1,988
Tax + insurance
−$826
HOA
−$213
Vac / Maint / Mgmt
−$1,062
Net cashflow
$967/mo
Annual
$11,606/yr
Cap rate
10.71%
Cash-on-cash
15.76%
DSCR
1.70
1% rule
1.33%
Cash to close
$106,120
Investor read
- This is a 3-bed/2.0-bath single-family listed at $379k.
- At list price, monthly cash flow is $967 ($12k/yr) — positive.
- The deal already cash-flows at list — no discount required.
- Meets the 1% rule at list price ($5k rent vs $379k).
- It's been on market 235 days — a 12% lower offer ($334k) is reasonable based on typical stale-listing flexibility.
- Recommended offer: $334k (12.0% below list) — sets the bar for market timing.
- Local home prices are declining (-3.0%/yr); year-one equity from $3k of loan paydown is wiped out by about $11k of value loss. Plan a longer hold.
- Location reads 75/100 on livability (#263 in FL, #4,209 nationally) — a middle-class / working-renter tenant base. Strengths: crime A+, cost of living A+, health & safety A+; Watch: schools F, amenities F, employment F.
- Lee (suburban): math 47% / reading 50% proficiency, ranked #42 of 73 in FL (top 58%) — families likely to look elsewhere, expect single-tenant / working-renter base with shorter leases.
- Watch-outs: flood insurance adds $427/mo.
- Market conditions: Rents soft (-1.2%/yr); 1244 active listings in the ZIP; 18 comparable units currently listed for rent nearby; rentals at typical pace (median 16d on market — plan ~3-4 weeks tenant-placement turnaround); solid renter incomes; 15,411 units permitted in Lee County in 2024 (4,686 in 5+ unit buildings).
- Lee County population projected at +44% by 2050 — long-run rental-demand tailwind backs the buy-and-hold thesis.
- Climate carrying-cost: in FEMA flood zone AE (mandatory federal flood insurance); severe wind risk, 99% chance of damaging wind over 30y; extreme-heat days projected 7→29/yr by 2055 (HVAC capex compounding) — expect insurance premiums to compound above CPI over the hold.
- Cap rate 10.7% vs local median 2.9% in Harlem Heights — top-decile yield for the area; either an underpriced asset or a hidden risk that comps aren't pricing in. Stress-test before assuming the spread holds.
- At $5,056/mo this rent would consume 80% of the median local household income ($75k/yr) (locally 1944% of renters already pay >50% of income on rent) — very limited rent-growth headroom before tenants either downsize or default.
Questions for listing agent
- It's been on market 235 days. Have you received any prior offers? Is the seller open to a 12% concession, seller financing, or rate buy-down credit?
- What's the actual annual flood-insurance premium (NFIP or private), and is the property in a SFHA with mandatory coverage?
- What does the HOA fee cover, when was the last increase, and are there any pending special assessments or reserve-fund shortfalls?
- Why hasn't it sold? Are there any deal-killer items the seller is aware of (foundation, flood, title, zoning, code violations)?
- Is there a deadline driving the sale (1031 exchange, divorce, estate, relocation)? That informs how much negotiation room exists.
- Schools are F-rated, which usually means shorter tenancies and higher turnover. Who's the typical renter profile here, and what's been the actual vacancy rate?
- What's the average days-on-market for RENTAL listings here right now (not sales)? A rising rental-DOM trend means longer vacancies and softer asking-rent achievability than the comps imply.
- What's the recent tenant-quality profile in this submarket — average credit score on applications, eviction rate, late-payment / NSF rate, and stable-employment percentage? A property-management company in the area should have these aggregated.
CashFlowRE · CFR-R8NJX5BF0PBR27
· Data 3 days ago
cashflowre.app · 2026-05-29