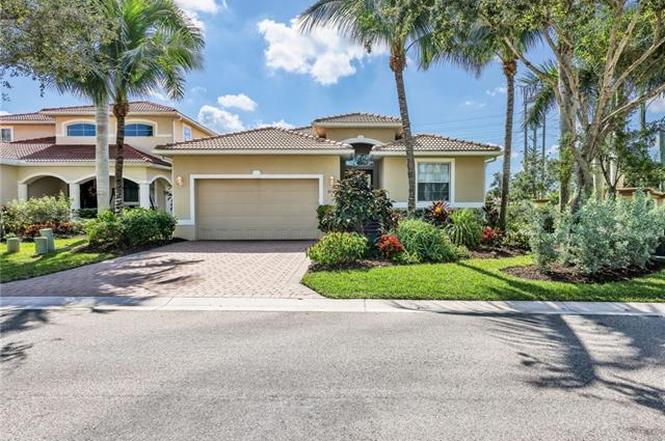
8753 Banyan Bay Blvd · Harlem Heights, FL
Flood risk 9/10 · Severe
- FEMA flood zone
- AE
- Chance of flooding over 30 yrs
- 0.99%
- Est. flood insurance / yr
- $1,737 – $8,500
Fire risk 2/10 · Minimal
- Est. fire insurance / yr
- $947 – $1,759
Heat risk 10/10 · Severe
- Hot days now (above 107°F)
- 7 days/yr
- Hot days in 30 yrs
- 29 days/yr
Wind risk 10/10 · Severe
- Chance of severe wind over 30 yrs
- 99.0%
Air-quality risk 2/10 · Minimal
- Unhealthy air days now
- 1 days/yr
- Unhealthy air days in 30 yrs
- 1 days/yr
Risk factors via First Street. Map © Google.
Why this score? — see what drove the B+ grade
The composite is a weighted blend of 9 inputs, each scored 0–100. Each bar is that input's sub-score; the figure is the points it added to the 100-point composite (weight × sub-score).
- Cash flow +29.8/30.0
- ARV discount +15.0/15.0
- DSCR +10.0/10.0
- 1% rule +8.3/10.0
- Schools +4.1/10.0
- Livability +3.8/5.0
- Condition / age +2.5/5.0
- Rent growth +2.2/5.0
- Appreciation +0.0/10.0
$379,000
🖨 Deal sheet 📄 Offer letter ✓ Due diligence
Listing remarks
Nestled on a lush corner lot in the gated Banyan Bay community in Fort Myers, this 3-bedroom + den, 2-bathroom, home offers relaxed Florida living just 8 miles from Fort Myers Beach. Spanning 1,998 square feet, the open-concept design features a split bedroom layout and a bright great room with a tray ceiling and abundant natural light that flows seamlessly into the dining area and open kitchen. The kitchen showcases white shaker cabinetry, quartz countertops, a large island with pendant lighting, a walk-in pantry, and newer GE stainless steel appliances (2023). The private primary suite includes a tray ceiling, spacious walk-in closet, and a beautifully updated ensuite bathroom with quartz
Key facts
- Gated community
- Quartz countertops
- Open concept design
Tags
Property features AI
Finance
- HOA & community: Mandatory HOA (professional management); Quarterly HOA fee; HOA amenities include community pool and BBQ/picnic area; HOA maintenance covers irrigation water, legal/accounting, manager, recreation facilities, security, street lights, and street maintenance; Total annual recurring fees listed; One-time fees apply
Exterior
- Parking: Deeded parking; Attached 2-car garage; Auto garage door
- Security: Community security (managed by HOA)
- Utilities: Central water; Central sewer; Cable available; Electric service (central)
- Home design: Single family residential; 1 story / ranch; Rear exposure faces south; Gated community (Banyan Bay)
- Construction: Built in 2012; Concrete block construction; Stucco exterior; Tile roof
- Exterior features: Patio; Screened lanai/porch
Interior
- Kitchen: Island; Walk-in pantry; Breakfast bar; Eat-in kitchen; Range; Microwave; Dishwasher; Disposal; Refrigerator/Freezer
- Bedrooms: 3 bedrooms plus den; First floor bedroom; Master bedroom on ground level; Split bedrooms
- Flooring: Carpet; Tile
- Bathrooms: 2 full bathrooms; Master bath with dual sinks and separate tub and shower
- Heating & cooling: Central electric heat; Central electric air conditioning; Ceiling fans
- Interior features: Cable prewire; Foyer; French doors; Laundry tub; Pantry; Smoke detectors; Tray ceiling; Walk-in closet; Great room floor plan; Split bedroom layout; Den/Study; Screened lanai/porch
- Laundry & utility: Laundry in residence; Washer/dryer hookup; Laundry tub
Neighborhood map
What this means for you Summary
Snapshot
- This is a 3-bed/2.0-bath single-family listed at $379k.
Deal economics
- At list price, monthly cash flow is $967 ($12k/yr) — positive.
- The deal already cash-flows at list — no discount required.
- Meets the 1% rule at list price ($5k rent vs $379k).
- Recommended offer: $334k (12.0% below list) — sets the bar for market timing.
- Cap rate 10.7% vs local median 2.9% in Harlem Heights — top-decile yield for the area; either an underpriced asset or a hidden risk that comps aren't pricing in. Stress-test before assuming the spread holds.
Location & tenants
- Location reads 75/100 on livability (#263 in FL, #4,209 nationally) — a middle-class / working-renter tenant base. Strengths: crime A+, cost of living A+, health & safety A+; Watch: schools F, amenities F, employment F.
- Lee (suburban): math 47% / reading 50% proficiency, ranked #42 of 73 in FL (top 58%) — families likely to look elsewhere, expect single-tenant / working-renter base with shorter leases.
- Market conditions: Rents soft (-1.2%/yr); 1244 active listings in the ZIP; 18 comparable units currently listed for rent nearby; rentals at typical pace (median 16d on market — plan ~3-4 weeks tenant-placement turnaround); solid renter incomes; 15,411 units permitted in Lee County in 2024 (4,686 in 5+ unit buildings).
- At $5,056/mo this rent would consume 80% of the median local household income ($75k/yr) (locally 1944% of renters already pay >50% of income on rent) — very limited rent-growth headroom before tenants either downsize or default.
Forward outlook
- Local home prices are declining (-3.0%/yr); year-one equity from $3k of loan paydown is wiped out by about $11k of value loss. Plan a longer hold.
- Lee County population projected at +44% by 2050 — long-run rental-demand tailwind backs the buy-and-hold thesis.
Negotiation context
- It's been on market 235 days — a 12% lower offer ($334k) is reasonable based on typical stale-listing flexibility.
Risks & watch-outs
- Watch-outs: flood insurance adds $427/mo.
- Climate carrying-cost: in FEMA flood zone AE (mandatory federal flood insurance); severe wind risk, 99% chance of damaging wind over 30y; extreme-heat days projected 7→29/yr by 2055 (HVAC capex compounding) — expect insurance premiums to compound above CPI over the hold.
Questions for the listing agent
- It's been on market 235 days. Have you received any prior offers? Is the seller open to a 12% concession, seller financing, or rate buy-down credit?
- What's the actual annual flood-insurance premium (NFIP or private), and is the property in a SFHA with mandatory coverage?
- What does the HOA fee cover, when was the last increase, and are there any pending special assessments or reserve-fund shortfalls?
- Why hasn't it sold? Are there any deal-killer items the seller is aware of (foundation, flood, title, zoning, code violations)?
- Is there a deadline driving the sale (1031 exchange, divorce, estate, relocation)? That informs how much negotiation room exists.
- Schools are F-rated, which usually means shorter tenancies and higher turnover. Who's the typical renter profile here, and what's been the actual vacancy rate?
- What's the average days-on-market for RENTAL listings here right now (not sales)? A rising rental-DOM trend means longer vacancies and softer asking-rent achievability than the comps imply.
- What's the recent tenant-quality profile in this submarket — average credit score on applications, eviction rate, late-payment / NSF rate, and stable-employment percentage? A property-management company in the area should have these aggregated.
- How much new for-sale + rental construction is in the pipeline within 1–3 miles? Heavy new supply typically softens prices + rents 12–24 months out; constrained supply supports both.
Investment metrics
- 1% rule
- 1.33% ✓
- Cap rate
- 10.71%
- Cash-on-cash
- 15.76%
- DSCR
- 1.70
- GRM
- 6.2
CMA / ARV
- ARV (on-the-fly)
- $735,264
- Comps found
- 8
Show comp detail 8 sales within ~0.75 mi
| Address | Dist | Beds/Ba | Sqft | Sold | Price | $/sf | Match |
|---|---|---|---|---|---|---|---|
| 16499 Edgemont Dr | 0.35mi | 2/2.0 (-1) | 1,949 (-2%) | 3mo | $740,000 | $380 | 72 |
| 16436 Willowcrest Way | 0.30mi | 3/2.0 | 1,853 (-7%) | 5mo | $769,900 | $415 | 69 |
| 16445 Edgemont Dr | 0.44mi | 3/2.0 | 2,003 (+0%) | 16mo | $737,000 | $368 | 65 |
| 16440 Willowcrest Way | 0.30mi | 3/2.0 | 2,066 (+3%) | 23mo | $730,000 | $353 | 61 |
| 16404 Willowcrest Way | 0.36mi | 3/2.0 | 1,781 (-11%) | 11mo | $470,000 | $264 | 56 |
| 16488 Crown Arbor Way | 0.65mi | 2/2.0 (-1) | 2,000 (+0%) | 18mo | $559,000 | $280 | 50 |
| 16320 Willowcrest Way | 0.56mi | 3/2.0 | 1,763 (-12%) | 9mo | $635,000 | $360 | 47 |
| 16384 Willowcrest Way | 0.41mi | 2/2.0 (-1) | 1,763 (-12%) | 15mo | $757,500 | $430 | 44 |
Match score weights: distance 35% · size 25% · config 20% · recency 20%. Top-matched comps best support the ARV.
Projected returns pro-forma
-3.0% appreciation · 0.0% rent growth · sell at horizon
- IRR
- -3.7%
- Equity multiple
- 0.87×
- Total profit
- $-14,304
- Equity at exit
- $56,510
- IRR
- 1.7%
- Equity multiple
- 1.10×
- Total profit
- $10,933
- Equity at exit
- $32,769
Cash invested: $106,120 (down + closing). Projections, not guarantees.
Landlord ↔ Tenant lean methodology
- Overall (STATE)
- 87 Strongly Landlord-Friendly
- State Florida
- 87 Strongly Landlord-Friendly · R+3
- County
- — inherits STATE
- City
- — inherits STATE
ZIP-level market 33908
- Home prices YoY
- -32.8%
- Rents YoY
- -1.2%
- Active inventory
- 1244
- Price-to-rent
- 6.2×
Monthly cashflow live
- Estimated rent
- $5,056 high interval (Pro) →
- Mortgage (P&I)
- −$1,988
- Tax from tax record
- −$242 /mo · $2,902/yr
- Insurance
- −$158
- Flood insurance flood zone
- −$427 /mo · $5,118/yr
- HOA
- −$213
- Vacancy / Maint / Mgmt
- −$1,062
- Net cashflow
- $967
Break-even live
UW: 25.0% down · 7.5% · 30yr · 1.5% tax · 5.0% vac · 8.0% maint · 8.0% mgmt
Financing live
Cash to close
- Down payment
- $94,750
- Closing costs
- $11,370
- Reserves months
- —
- Total cash needed
- —
Loan-product check · same deal, 3 products live
Conventional
25% down · 7.5% · 30yr
- Down + closing
- —
- Monthly P&I
- —
- Monthly cashflow
- —
- DSCR
- —
- Eligible?
- —
Personal DTI + credit; lowest rate.
DSCR
20% down · 8.5% · 30yr
- Down + closing
- —
- Monthly P&I
- —
- Monthly cashflow
- —
- DSCR
- —
- Eligible?
- —
No personal income docs; deal must DSCR.
Hard money
10% down · 12.0% · 12mo
- Down + closing
- —
- Monthly P&I
- —
- Monthly cashflow
- —
- DSCR
- —
- Eligible?
- —
Short-term bridge; refi at stabilization.
Rent comps 18 comps
| Address | Beds | Baths | Sqft | Rent | $/sqft | DOM | Units | Dist |
|---|---|---|---|---|---|---|---|---|
| 17006 Middlebrook Ct Fort Myers, FL | 2.0 | 2.0 | 1498 | $6,300 | $4.21 | 15d | 1 | 0.14mi |
| 17006 Middlebrook Ct Fort Myers, FL | 2.0 | 2.0 | 1247 | $6,300 | $5.05 | 14d | 1 | 0.14mi |
| 17020 Willowcrest Way Fort Myers, FL | 2.0–3.0 | 2.0 | 1344 | $6,300 | $4.69 | 15d | 2 | 0.36mi |
| 9190 Southmont Cv #309 Fort Myers, FL | 3.0 | 2.0 | 1331 | $6,500 | $4.88 | 1d | 1 | 0.39mi |
| 9170 Southmont Cv Fort Myers, FL | 2.0–3.0 | 2.0 | 1358 | $6,300 | $4.64 | 14d | 1 | 0.51mi |
| 9140 Southmont Cv #102 Fort Myers, FL | 3.0 | 2.0 | 1331 | $2,500 | $1.88 | 14d | 1 | 0.54mi |
| 9240 Willowcrest Ct Fort Myers, FL | 2.0 | 2.0 | 1752 | $8,500 | $4.85 | 14d | 1 | 0.54mi |
| 16320 Willowcrest Way Fort Myers, FL | 2.0 | 2.0 | 1751 | $8,700 | $4.97 | 14d | 1 | 0.57mi |
| 17120 Bridgestone Ct #104 Fort Myers, FL | 2.0 | 2.0 | 1282 | $2,400 | $1.87 | 23d | 1 | 0.58mi |
| 9201 Bayberry Bnd #103 Fort Myers, FL | 2.0 | 2.0 | 1724 | $3,500 | $2.03 | 23d | 1 | 0.61mi |
| 16491 Millstone Cir #207 Fort Myers, FL | 2.0 | 2.0 | 1348 | $2,000 | $1.48 | 14d | 1 | 0.64mi |
| 9240 Bayberry Bnd #103 Fort Myers, FL | 3.0 | 2.0 | 1584 | $6,600 | $4.17 | 23d | 1 | 0.66mi |
| 16481 Millstone Cir #207 Fort Myers, FL | 3.0 | 2.0 | 1348 | $2,700 | $2.00 | 23d | 1 | 0.68mi |
| 9241 Bayberry Bnd #103 Fort Myers, FL | 3.0 | 2.0 | 1584 | $4,725 | $2.98 | 14d | 1 | 0.68mi |
| 9250 Bayberry Bnd #202 Fort Myers, FL | 2.0 | 2.0 | 1669 | $4,950 | $2.97 | 14d | 1 | 0.69mi |
| 8549 S Lake Cir Fort Myers, FL | 3.0 | 2.0 | 2091 | $3,500 | $1.67 | 23d | 1 | 1.10mi |
| 11848 Bayport Ln #2002 Fort Myers, FL | 3.0 | 2.0 | 1661 | $2,200 | $1.32 | 23d | 1 | 1.29mi |
| 8986 Greenwich Hills Way #201 Fort Myers, FL | 2.0 | 2.0 | 2040 | $5,200 | $2.55 | 23d | 1 | 1.42mi |
HOA detail
- Monthly dues
- $213 · $2,556/yr
- Likely covers
- security
Listing history 15 events
-
2026-06-17days on market $379,000 Active 235 DOM
-
2026-06-16days on market $379,000 Active 234 DOM
-
2026-06-16days on market $379,000 Active 233 DOM
-
2026-06-13days on market $379,000 Active 231 DOM
-
2026-06-09days on market $379,000 Active 227 DOM
-
2026-06-07days on market $379,000 Active 225 DOM
-
2026-06-02days on market $379,000 Active 220 DOM
-
2026-06-01days on market $379,000 Active 219 DOM
-
2026-06-01days on market $379,000 Active 218 DOM
-
2026-04-15price $379,000
-
2026-03-19price $389,900
-
2026-01-08price $399,900
-
2025-10-25$414,900 Active
-
2011-11-02soldstatus $3,266,000
-
2008-08-29soldstatus $2,700,000
ⓘ Source: listings_history table (triggers on properties + properties_extension) + one-shot
backfill from property_details.listing_events for pre-trigger history.
Tax reassessment forecast FL · Resets to sale price
- Current annual tax
- $2,902 · $242/mo
- Projected year-2 tax
- $3,146 · $262/mo
- Expected delta
- +$243/yr (+$20/mo · 8.4%)
ⓘ Screening estimate from a state-policy table — verify with the county assessor before closing.
Climate risk First Street
- Flood 9/10 Extreme FEMA zone AE · 99% chance over 30 yrs
- Wildfire 2/10 Low
- Heat 10/10 Extreme 7 d/yr ≥107°F today · 29 d/yr by 30 yrs out
- Wind 10/10 Extreme 99% chance of damaging wind over 30 yrs
- Air quality 2/10 Low 1 unhealthy d/yr today · 1 by 30 yrs out
Nearby sold comps map
Loading sold comps map…
Walkable amenities ~0.75 mi
Loading nearby amenities…
Taxation est. · year 1
- Rental income
- $60,669
- − Mortgage interest
- −$21,230
- − Property taxes
- −$2,902
- − Insurance
- −$7,014
- − Repairs & maintenance
- −$4,853
- − Management
- −$4,853
- − HOA
- −$2,556
- − Depreciation
- −$11,025
- Taxable income
- $6,234
- Est. tax owed @ 24.0%
- −$1,496
- After-tax cash flow
- $10,110/yr
For passive investors: Depreciation is non-cash, so a rental often shows a tax loss while cash-flowing — sheltering income. Rental losses are passive: they offset passive income freely, and up to $25,000/yr can offset ordinary (W-2) income if you actively participate and your MAGI is under $100k (phasing out to $0 by $150k); unused losses carry forward. On sale, claimed depreciation is recaptured at up to 25%, and gains may owe capital-gains tax (a 1031 exchange can defer both). Figures are a year-1 estimate at your 24.0% rate — not tax advice; consult a CPA.
Schools (NCES district)
- District
- Lee
- NCES district ID
- 1201080
- Math proficiency
- 47% ▼ -11.00%
- Reading proficiency
- 50% ▼ -4.00%
- Median HH income
- $49,518
- Composite
- 41.49/100
- National rank
- #3458
- State rank
- #42 of 73 in FL
Livability — Harlem Heights
- Score
- 75/100
- State rank
- #263
- US rank
- #4209
Category grades
Schools grade is shown separately in the Schools card above.
Census & demographics
- County
- Lee County · 788,662 people
- City population
- 27,337
- Metro
- Cape Coral-Fort Myers, FL
- Population (ZIP)
- 37,423
- Household income
- $75,396
- Rent vs Own
- Severe rent burden
- 1944.0
Population outlook (Lee County) Hauer SSP2
- Today (2025)
- 871,946 people
- By 2030
- 955,468 · +9.6%
- By 2040
- 1,113,587 · +27.7%
- By 2050
- 1,256,891 · +44.1%
- By 2075
- 1,560,270 · +78.9%
- By 2100
- 1,726,848 · +98.0%
Race, ethnicity, and origin ACS 2023
- Neighborhood character
- Predominantly White (88%)
- Race & ethnicity
- White 88% Hispanic / Latino 6% Two or more races 5% Black 3% Asian 1%
- Hispanic origin (detail)
- Mexican 1% Puerto Rican 2%
- Common ancestry
- Romanian 5% Lithuanian 4% Slovak 3%
- Foreign-born
- 10% · Canada, Jamaica
- Languages at home
- 90% English-only · Spanish 4% Russian/Polish/Slavic 1% Other Indo-European 1%
Political lean MEDSL · Lee
- 2024 margin
- Strong R (+28.4) · D 35.5% · R 63.9%
- 2008→2024 swing
- -18.0pp toward R · 2008: -10.4pp · 2024: -28.4pp
- All cycles
- 2024: R+28.4 2020: R+19.2 2016: R+20.4 2012: R+16.6 2008: R+10.4
Not yet ingested
- Civics
- —
Market trends
- HPI YoY
- ▼ -102.22%
- Current HPI
- 209.7595
- Rent YoY
- ▼ -1.18%
- Metro
- Cape Coral-Fort Myers, FL
- State GDP YoY
- ▲ 3.28%
- F500 in state
- 36
Industry mix (Fortune 500 HQ in FL)
| Industry | F500 HQs | Revenue |
|---|---|---|
| Industrial Technology | 2 | $29B |
|
||
| Insurance | 2 | $17B |
|
||
| Retail | 1 | $60B |
|
||
| Technology Distribution | 1 | $58B |
|
||
| Homebuilding | 1 | $35B |
|
||
| Technology Manufacturing | 1 | $35B |
|
||
Price history
-86.0% since first listed6 events — show timeline
- 2026-04-15 Price Changed $379,000 BEARMLS
- 2026-03-19 Price Changed $389,900 BEARMLS
- 2026-01-08 Price Changed $399,900 BEARMLS
- 2025-10-25 Listed $414,900 BEARMLS
- 2011-11-02 Sold (Public Records) $3,266,000 Public Records
- 2008-08-29 Sold (Public Records) $2,700,000 Public Records
Property tax history
+0.8%/yrLatest (2025): $2,902 · +4.3% YoY. Source: county tax records.
Cash-flow waterfall
monthlySold comps — $/sqft
last 12 mo · ≤1 miLoading sold comps…