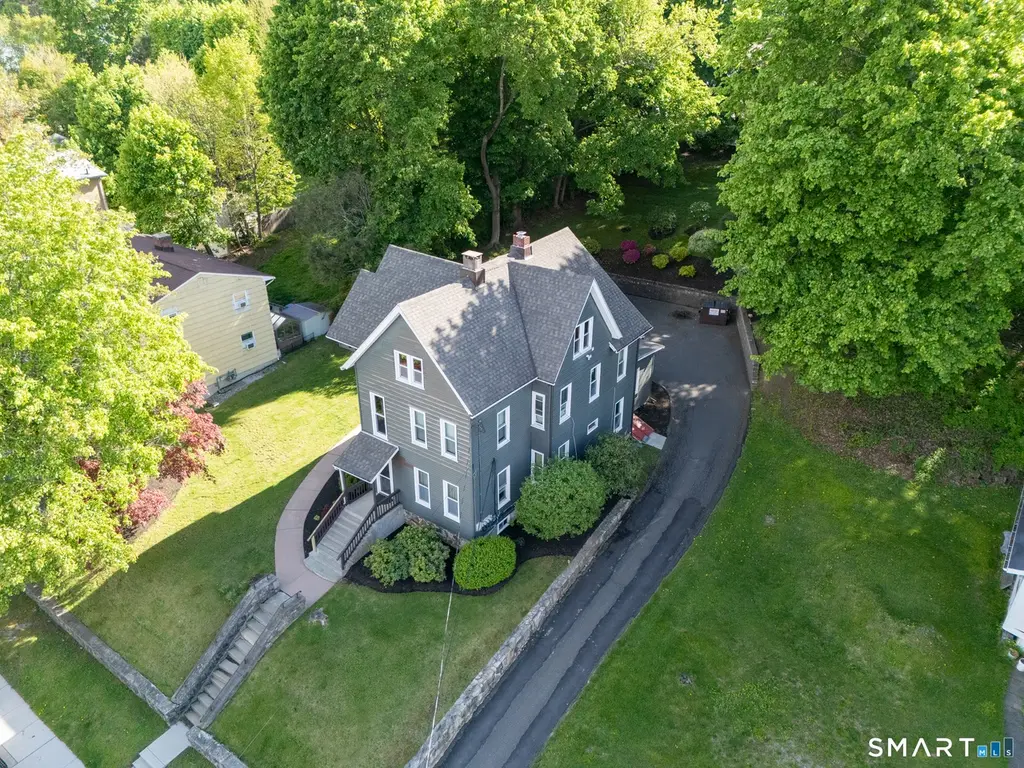
34 Grand St
Danbury, CT 06810
$799,900D-
4 bd · 3.0 ba ·
2,658 sqft ·
Built 1894
· MultiFamily
· Under Contract
· 6 DOM
Cashflow @ list (25.0% down · 7.5%)
Estimated rent
$6,795/mo
Mortgage (P&I)
−$4,195
Tax + insurance
−$1,033
HOA
−$0
Vac / Maint / Mgmt
−$1,427
Net cashflow
$141/mo
Annual
$1,689/yr
Cap rate
6.50%
Cash-on-cash
0.75%
DSCR
1.03
1% rule
0.85%
Cash to close
$223,972
Investor read
- This is a 3 × 2-bed/1.0-bath units multifamily listed at $800k.
- At list price, monthly cash flow is $141 ($2k/yr) — positive. Per door: $47/mo.
- The deal already cash-flows at list — no discount required.
- To meet the 1% rule (rent ≥ 1% of price), the offer needs to be $680k (15.1% below list).
- Only 6 days on market — expect competitive offers; lowballing is unlikely to land.
- Recommended offer: $680k (15.1% below list) — sets the bar for 1% rule.
- Local home prices are declining (-3.0%/yr); year-one equity from $6k of loan paydown is wiped out by about $24k of value loss. Plan a longer hold.
- Location reads 76/100 on livability (#51 in CT, #3,379 nationally) — a middle-class / working-renter tenant base. Strengths: commute A+, housing A+, health & safety A+; Watch: amenities F, cost of living F.
- Danbury School District (urban): math 19% / reading 32% proficiency, ranked #131 of 153 in CT (top 86%) — low school quality limits family demand, transient renter base, plan for 1-2y turnover.
- Zoned schools: South Street School (math 22% / reading 32%, grade F, #401 of 553 statewide, top 74%, 386 students, 47% FRL); Danbury High School (math 19% / reading 41%, grade F, #137 of 194 statewide, top 70%, 3,590 students, 48% FRL).
- Watch-outs: built in 1894 — expect roof / HVAC / electrical / plumbing capex.
- Market conditions: Rents rising (+3.1%/yr); 197 active listings in the ZIP; 2 comparable units currently listed for rent nearby; solid renter incomes; 1,151 units permitted in Western Connecticut Planning Region in 2024 (714 in 5+ unit buildings).
- Climate carrying-cost: moderate wind risk, 26% chance of damaging wind over 30y; extreme-heat days projected 7→15/yr by 2055 (HVAC capex compounding) — expect insurance premiums to compound above CPI over the hold.
- Cap rate 6.5% vs local median 3.6% in Danbury — top-decile yield for the area; either an underpriced asset or a hidden risk that comps aren't pricing in. Stress-test before assuming the spread holds.
- At $6,795/mo this rent would consume 106% of the median local household income ($77k/yr) (locally 3255% of renters already pay >50% of income on rent) — very limited rent-growth headroom before tenants either downsize or default.
Questions for listing agent
- Can we see the unit-by-unit rent roll, current vacancy, and any below-market leases? What's the average tenancy length?
- What capital expenditures (roof, boiler, parking lot, exteriors) have been made in the last 5 years, and what's planned in the next 2?
- Built in 1894 — when were the roof, HVAC, electrical panel, plumbing, and water heater last replaced?
- Is there a deadline driving the sale (1031 exchange, divorce, estate, relocation)? That informs how much negotiation room exists.
- Schools are D-rated, which usually means shorter tenancies and higher turnover. Who's the typical renter profile here, and what's been the actual vacancy rate?
- The area grade is low — what's the realistic commute time and amenity access for the typical tenant pool here? Any planned neighborhood developments (good or bad) we should know about?
- What's the average days-on-market for RENTAL listings here right now (not sales)? A rising rental-DOM trend means longer vacancies and softer asking-rent achievability than the comps imply.
- What's the recent tenant-quality profile in this submarket — average credit score on applications, eviction rate, late-payment / NSF rate, and stable-employment percentage? A property-management company in the area should have these aggregated.
CashFlowRE · CFR-R9BPDWDZ12WG7E
· Data 2 weeks ago
cashflowre.app · 2026-05-29